For my colleagues who teach AP Stats, there are few phrases more terrifying:
Today I am teaching Power.
Power: a deep statistical concept, but one which often gets moved towards the back of the AP Stats junk drawer. The only mention of power in the AP Stats course description comes under Tests of Significance:
Logic of significance testing, null and alternative hypotheses; p-values; one- and two-sided tests; concepts of Type I and Type II errors; concept of power
So, students need to understand the concept of power, but not actually compute it (which is itself not an easy task). Floyd Bullard’s article “On Power” from the AP Central website provides solid starting points for teachers struggling with this concept; specifically, I appreciate his many ways of considering power:
- Power is the probability of rejecting the null hypothesis when in fact it is false.
- Power is the probability of making a correct decision (to reject the null hypothesis) when the null hypothesis is false.
- Power is the probability that a test of significance will pick up on an effect that is present.
- Power is the probability that a test of significance will detect a deviation from the null hypothesis, should such a deviation exist.
- Power is the probability of avoiding a Type II error.
This year, I tried an activity which used the third bullet above, picking up on effects, as a basis for making decisions.
HEY KOOL-AID MAN!
 Arriving at school early, I got to work making 3 batches of Kool Aid. During class, all students would receive samples of the 3 juices to try. Students were not told about the task beforehand, or where this was headed. Up to now, we had discussed type I and type II error, so this served as a transition to the next idea.
THE BASELINE SAMPLE:
All students received cups and as they worked on a practice problem I circulated, serving tasty Kool Aid – don’t forget to tip your server! I told students to savor the juice, but to pay attention: I promised them that this first batch was made using strict Kool Aid instructions. Think about the taste of the juice.
SAMPLE A:
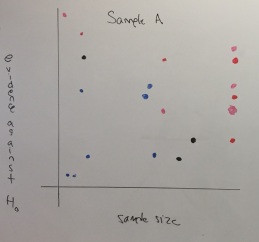
Next, students received a drink from “Sample A”. Their job – to assess if this new sample was made using LESS drink mix than the baseline batch. Also, I varied the amounts of juice students received: while some students were poured full cups, some received just a few dribbles. To collect responses, all students approached the board to contribute a point to a Sample A scatterplot, using the following criteria:
 Sample size: how much juice you were given
Evidence: how much evidence do you feel you have to support our alternate hypothesis – that Sample A was made with LESS mix than the baseline?
As you can see, the responses were all over the place – a mixture of “we’re not quite sure” to “these are strange directions” to “I just don’t trust Lochel – something’s up”. But the table has been set for the next sample.
Sample A: it was made with just a smidge less mix than the baseline. So I wasn’t totally surprised to see dots all over.
SAMPLE B:
 I poured drinks again from this new sample, and again varied the sample sizes. I asked all students to think about their evidence in favor of the alternate, and wait until everyone tasted their juice before submitting a dot.
And check out those results! Except for a few kids (who admitted they stink at telling apart tastes), we have universal support in favor of the alternate hypothesis.
Sample B: this was made with 1/2 the suggested amount of drink mix. Much weaker!
FOLLOW-UP DISCUSSION:
This activity made the discussion of power much more natural. In particular, what could occur during a study which would make it more likely to reject the null hypothesis, if it deserves rejecting?
Larger sample size: smaller samples make it tough to detect differences
Effect size: how far away from the null is the “truth”. If the “truth” as just a bit less than the null, it could be difficult to detect this effect.
In terms of AP Stats “concepts of power”, this covers much of what we need. Next, I used an applet to walk students through examples and show power as a probability. And like most years, this was met with googly eyes by many, but the foundation of conditions which would be ripe for rejecting the null was built, and I was happy with this day!
Suggested reading: Statistics Done Wrong by Alex Reinhart contains compelling, clear examples for teachers who look to lead discussions regarding P-value and Power. I recommend it highly!


