I use College Board released AP items often in my Statistics course. The problems are aligned to clearly-stated goals, and the solutions provide insight not only into the grading of AP questions but also allow students to study well-articulated explanations. You can visit the College Board Statistics website and explore. Jason Molesky’s website provides helpful guidance on using FRAPPY’s (Free-Response AP Practice…Yay!) as a formative assessment tool in AP Stats.
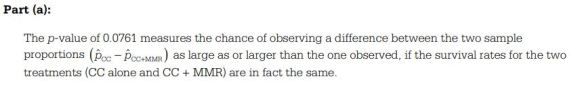
Each free-response solution begins with the “model solution” – the ideal explanation a student would provide for full question credit. It is not unusual for Statistics students to struggle with clear communication, and having students read and dissect the model solution can be helpful in strengthening statistical arguments. A few times this year, I have used the model solution as a formative assessment tool with an activity I call “Assembling the Model Solution”.
Here’s how it works – start with an AP Free-Response question with a narrative aspect. Today, I chose a problem which requires students to interpret a P-value, from 2009:
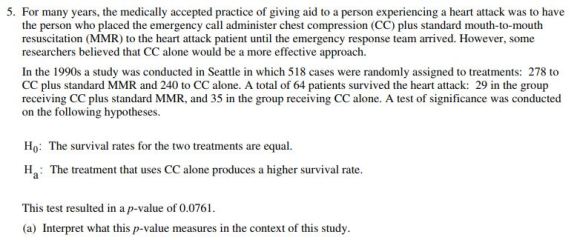
The model solution contains a number of non-negotiable elements: a conditional probability, a reference to smple results, and the “extremeness” of results.
Next, I took the model solution as broke it into small, strategic “bites”. At the same time, I added some parallel distractors and a junk phrase or two.
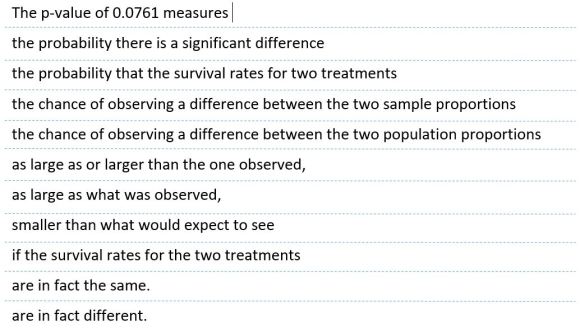
Then, use a paper cutter and slice the Word document into phrase slices, and paper clip together. All students then received the problem and the slips of paper, with the challenge to assemble the model solution for part a of the problem.


The conversation were rich, and the teams mostly debated the salient aspects of the problem apprpriately. The biggest points of debate and incorrect solutions came from:
- The difference between “sample” and “population” proportions.
- The assumption of sameness in the treatments as the conditional aspect of P-value.
I have used this strategy a few times now, and continue to tweak how I provide the slips of paper. I’m also looking at digital options, but I like the social aspect of moving the slips of paper. The method is not ideal for everything in AP Stats, but there are a few areas in our curriculum where this fits in nicely:
- Sampling and experimental design
- Conclusions for inference procedures
- Describing distribuitions.
You can download my file for this activity here. Enjoy!
- Credit to Jon Osters and the AP Stats glitterati who rightfully pointed out that my original post spelled “Yay!” incorrectly.
