A problem I gave as review for our statistics test today became not only a source of conversation regarding vocabulary, but provided me some insight into the problem solving approaches of my students.
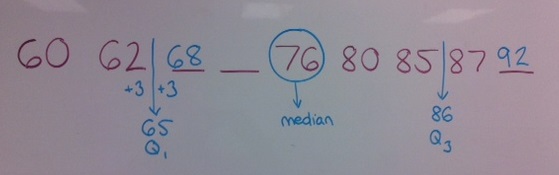
Here’s the problem. A list of numbers is given, listed in order, with some numbers removed:

The list has the following characteristics:
- A mean of 76
- A range of 32
- An inter-quartile range of 21
Many students quickly understood the last blank must be 92, due to the range, but then became stuck. As we’ve never explicity seen a problem like this before, the reactions from students was fascinating. Some pockets of students had no fear in drawing circles and arrows to break down the data set. Others preferred to talk ideas out, but without putting pen to paper this doesn’t lead to solutions right away. I was thrilled to see a few students step up and take the lead, and explain their ideas to others, which then led to breakthroughs. Identifying the positions of median and quartiles here lets us fill in one of the missing numbers:
But a subset of my class was content to watch from afar, waiting for hints which they assumed would come. Or worse, tuning out until I presented an explanation to the class….which never came.
And that last blank caused more trouble than I would have expected, as some students had trouble making the connection between the mean of a data set and the sum of its elements. To help with this, I asked struggling students to provide me with any 4 numbers which had a mean of 10 (making them different numbers). I asked students what I should be looking for to check accuracy besides computing the mean….and then, the light bulb! All lists need to add up to 40! So without explictly doing the empty blank problem in front of us, I sent students back to the board to think about this fact. And the results were satisfying, as many of my fringe students could now complete the task and explain their procedure to their peers.
Students need to understand math ideas in many forms, and the concept of mean here demonstrates this need. If you ask a student how to compute a mean, they most likely have little difficulty, and have had much practice:
Mean = sum of “scores” / count of “scores”
But in the missing numbers puzzle, the concept “felt” different and thus “new” to many students. For me, this is where many students struggle in math classrooms. Are we showing students how ideas and problems connect to big ideas? Or does each combination of an existing problem become treated like a new experience? It’s hard to break the pattern of students wanting specific rules for each type of math problem, when this is often the math conditioning they receive. But it’s worth the hard-fought battle.
And if you had fun with the challenge at the start of this post, try the similar problem I give later as an assessment:


