This past week, I worked with 2 Algebra 1A classes, which were working through solving one-variable equations. By the time of my visit, students had worked through solving equations which had a variable on both sides, some which required students to combine like terms, and some where the distributive property was required.
The students in the class had been exposed to the traditional series of worksheets, drills, and various games to keep the class motivated. Homework the previous night consisted of problems like the one below:
My challenge to the class was to work with me to think about these one-variable equations differently. Rather than thinking of the equation as a whole, we have two expressions, one on the left and one on the right. While by this point in algebra 1 the students do not know how to graph a linear equation, this lesson provides a good opportunity to open that door. By this point, students do understand that:
- Expressions can be evaluated, given a value for x, and this provides an output (y).
- Function tables provide ordered pairs which can be plotted
- While we often are asked to “plug in” a specific value for x, we can plug any value into most expressions and obtain an output.
So, let’s use this background to our advantage and bring consider a graphical method for solving one-variable equations. The class I worked with used laptops, and worked through some examples using the Desmos Calculator.
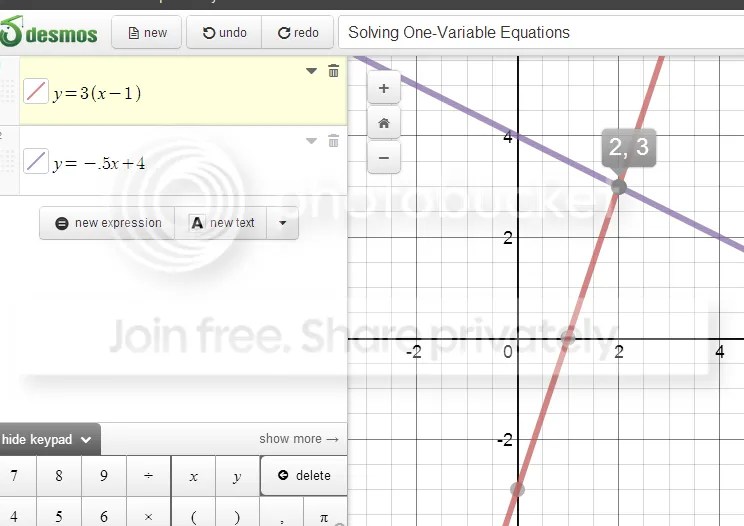
Students generally understood that we had strong interest in that point of intersection. But what does the x represent? What is the y? Which one represents the solution we seek? And what a great review of ordered pairs, more work with functions, and a preview of linear functions. Students worked through function table with me on this worksheet, and used the grapher to work through problems on their own.


Working with this class produced some rich discussions, particularly when the class was faced with a problem which had no solution, or a problem which had a “messy” solution. Discussing the parallel lines in teams strengthened the students understanding of “no solution” problems, and problems with messy fractional solutions became possible.
The activity also provided a nice segue to inequalities. By problem 6 on the worksheet given above, a number of students noted that they could look at when one line was “above” the other. And some nice foreshadowing of linear systems has been built into early units.
Should students be proficient in traditional algorithms for solving equations? Of course! But looking at algebraic ideas using multiple representations often lets students personalize their learning by assessing methods and making connections between tables, equations and graphs.
