Categories
Statistics

Monopoly Math

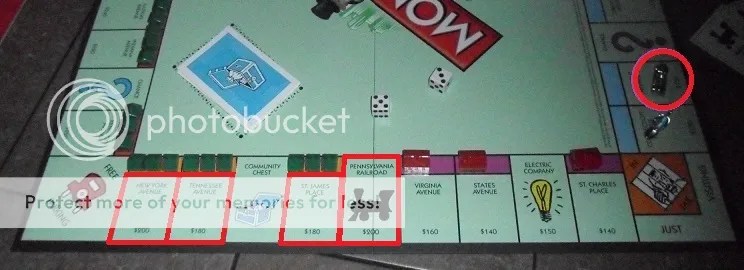
The big Monopoly battle is coming near its end, and the iron and racecar are battling for Monopoly supremacy.

Monopoly Board

Both players own properties on the next block, and have some spaces they’d like to avoid.  For the car, here are the spaces he’d like to avoid.

Car Spots

And for the iron, there are a few spaces to avoid.

Monopoly - Iron 1

Since there some houses and hotels on some of the spaces, they are worth different amounts.  Below, here is how much each player will have to pay if they land on the “bad” spaces.

Car Board B

Monopoly - Iron 2

So, here’s the question:  which player is in “worse” shape?  Which player should be more worried about their upcoming turn?

Let this stew with your classes, and would enjoy hearing some class reflections.  The big reveal will come in a few days.

Categories
Algebra

Linear Programming with Friends

An early morning post from Nik_D from the UK led to sharing class activities for linear programming, and provided a great example for me to share with colleagues on the value of twitter:

The activity on Fawn’s blog invites students to build Lego furniture and find the combination which will maximize profit.  I love the idea of handing students baggies with the “supplies” and having students build the chairs and tables.  But, without having Legos around, both Nik and I sought a way to approach these linear programming problems with a different hands-on approach.  In previous years, I had used sticky dots to help students visualize constraints and a fesible region.  Nik posted about his experiences last week, and now I am happy to share the U.S. point of view

Here, I worked with a freshman-year teacher who was eager to try something different to open linear programming.  As students wandered into class, they were given the initial problem.  The Powerpoint slides are available for you to use.

LP1

The class worked in teams to consider the problem.  Many start off by making data tables of the possibilities.

Student work 1

As the teacher and I circulated the room, we found that eventually, students consider algebraic models.

Student work 2

There was agreement on solution: 2 chairs and 2 tables are ideal.  The teacher asked students to share their ideas, which were written on the board, and led to new vocabulary: constraints, profit function.  We’re now ready to tackle our next challenge:

LP2

Many groans were heard, as students understood that “guess and check” would no longer be a great idea.  Note that the chair design also changes, which a student cleverly noted was from the “Game of Thrones” collection.

First, the class agreed on the constraints:

Then, for this part of the activity, the class is split into two groups, one for each constraint, which both the lead teacher and I worked with to explain the guidelines.  A spreadsheet with 50 identical “strategically selected” points were given to both groups, along with a pack of stickers.  The group task: test each of the points for their given constraint, and place a sticker on the wall if it satisfies the constraint.  The “small block constraint” group was given blue dots, while the “large block constraint” group had red dots.  After a few moments of organizational chaos, leaders emerged, and points were distributed nicely to the team.  Soon, dots made their way to the board.

Dots1

After both groups were satisfied with their work, the teacher (Joe, below) discussed the dot patterns.  Where do the dots share space?  Where are there only reds, blues?  What parts of their graph are most important for this problem?  Then, I grabbed Nik_D’s idea by turning on the Desmos calculator and super-imposing  the inequalities onto the graph.  There was some prep work needed here, as Joe and I made sure the grid paper was placed nicely on his SMART board.  Also, please note that I seem to suck at taking clear pictures….it’s a probem.

Joe G.

One thing we would do differently here is letting students see the inequalities.  We hid them, so as to maximize screen space.  This would allow the teacher to turn the inequalities on or off, and emphasize where the colored dots reside.

The class discussion continued with an argument of how to identify the “maximizing” point, and the corner-point principle.

One last thought here.  The power of Desmos is evident for linear programming problems.  The teachers I work with agree that having students graph these sorts of problems by hand is not only time-consuming, it is silly.  By letting students experience the Desmos calculator, not only can we have real discussions of problems, we can tackle problems which may not be so graph-friendly.

Thanks to Nik D. and Fawn for the sharing!

Categories
Algebra Technology

Those Funky, Funky Exponential Functions!

A neat math discussion came from an unexpected place today when a teacher in my department sought me out with the TI Nspire of one of her students in hand. The student was in a pre-calc class where exponential functions were being examined, and attempted the graph the following:

What should we expect to see?  How does this graph behave?  Here is what my new Nspire app gave me, which matches what the student calculator showed.

Nspire1

There seems to be a little funkiness around the origin which confused the Nspire, but the bigger issue is that the meat and potatoes of the graph is just wrong.  This about these values of this function and you’ll see why:

This function be-bops around in a quite interesting manner, and the TI-84 shows the graph nicely, as individual dots.  After going through some usual diagnostics in my head, and the list of dumb things kids sometimes do to calculators which cause them to act funny, the problem seems to be with Nspire. But this got me thinking about this strange function, and it’s behavior.  What happens if x = 1/2?  2/3?  3/2?  What’s the domain of this function?  And how do some of my other online math tool friends handle this one?

Wolfram|Alpha is our first contestant.  Show me your stuff:

Wolfram

How cool!  And what a neat discussion of complex numbers, and an interesting overlap between real and complex parts.  Wondering if anyone has insight into the domain and range though.  Is it that this function has no domain?  Or is it that  the domain is simply too difficult to express nicely?

Next up is my old friend Desmos.  I know you won’t let me down.  First, entering the function, Desmos does nothing (trust me, no screencap…nothing happens).  But, activate the table and you can plot some points.  I also added a few of my own at the end of the table:

Desmos

A good effort, but wish there was some indication of the graph’s behavior without the table.

Overall, this is a tricky little function with a lot to talk about.  Put it on the board for your classes and let them think about:

  • What rational values cause the function to be undefined over the reals?
  • What rational values cause the function to have negative value?  Positive value?

Then, the plot THICKENS!  Later in the day, I was showing of my Nspire app and the goofy function to some math friends at a meeting, when an English teacher collegue joined the fray.  After giving us the obligatory “what a bunch of geeks” staredown, she grabbed my iPad and gave a few finger swipes at the graphs, changing the window values and……

Nspire2

Holy crud!  How cool, yet….pretty much not useful at all!  During the day, I also sent a note out to TI about what I had found, and a response was given later in the day.  Thanks for getting back to me so quickly TI folk!