My 9th graders has been working through a unit on linear functions. This co-taught class contains students who went through a traditional Algebra 1 class in semester 1, and are now in a course with me as preparation for the Pennsylvania Keystone Alegbra 1 Exam in May. While developing core algebra skills is a goal for this course, the literacy skills are also a challenge. The Keystone exam is language-heavy, and these students need as many opportunities as possible to read and communicate.
WHAT I DIDN’T WANT TO DO:
- Provide endless worksheets and textbook problems with no context
- Introduce technology tools after “traditional” mastery
WHAT I SET OUT TO DO:
- Provide multiple means to evaluate linear function scenarios
- Use technology from day 1 to evaluate data
- Allow an opportunity to peer-assess student works
 Wanting to stress contexts from day 1, I used the site Graphing Stories by Dan Meyer and BuzzMath, as an opener a few times within the first 2 weeks of class. The site provides 15-seconds video of a scenario (such as time vs height on a rope swing), and students use pre-made graph paper to develop a graph which matches the scenario. As an opener, I appreciate this site as a place to start conversations. A document camera is used to display student works, which are randomly chosen from my handy popsicle stick collection.
In algebra class, students often learn slope as rise / run, and my students were able to recall this “definition”. Almost all students were able to recall the slope formula, given two points, and could compute a correct slope (with some minor math errors). But considering slope as a rate of change within a context was a mostly new experience.
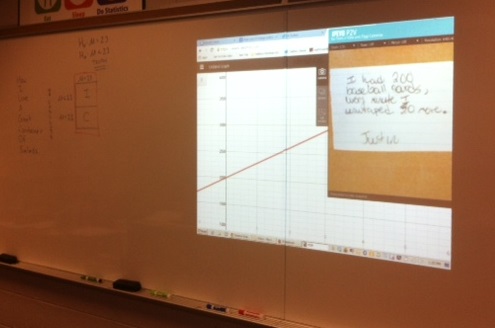
For each of the last few days (after we had seen many of the Graphing Stories), I have given a similar opener. A graph is given, and students must give the equation, AND a sentence which provides a possible scenario for the graph. Sort of an inverse-Graphing Story. Here was today’s opener:

After a few minutes, I collected the student responses, which were written on index cards. In our review phase, I shuffled the cards, and chose random samples of student works to share under the document camera. The projector showed the original graph, along with the story:
“I had 200 baseball cards, every minute I unwrapped 30 more”
To check the student’s story, we looked at two criteria:
- Does the story have a correct starting point?
- Does the story have a correct rate of change?
Results are still mixed, ranging from responses which are on-point or emerging:
- “Tommy saw 200 bugs, every second 30 more bugs showed up” (I have a lot of critters in my room)
- “I start with $200 and I get $30 each week”
- “There are 200 people with car insurance every hour 20 people get car insurance when they see the Geico commercial”
To those who still need more practice:
- “Every 70 days 200 pizzas come to the pizza shop”
- “There were 30 spiders and every minute 200 more spiders come”
- “There are 30 toddlers each earn 200 pennies”
But the responses get better every day, and we celebrate the successes of those who improve, and learn to critique work appropriately!

3 replies on “Linear Function Stories”
Wow! I also teach Algebra IB, just up the road from you. Like you, I am working like crazy to create tasks that reinforce conceptual understanding of a rate of change and y-intercept. Thanks for sharing! This lesson NAILS IT!!!
How did you project both the doc cam and your computer at the same time? I have something different than the ipevo you are using. For mine you choose to view PC or the doc cam. Do you have the doc cam feeding into your PC somehow and then out to the projector?
The doc cam software (which came with the IPEVO) comes up as window. I can make it full screen, but I can also keep it as a smaller window if I like.