 A map of Argentina….a class of impressionable 9th graders…and a devious teacher….what could go wrong? I’m currently reviewing past statistical ideas with my 9th graders, with an eye towards standard deviation, the normal curve and sampling. To generate some data, I asked each of my classes 2 questions about the country of Argentina:
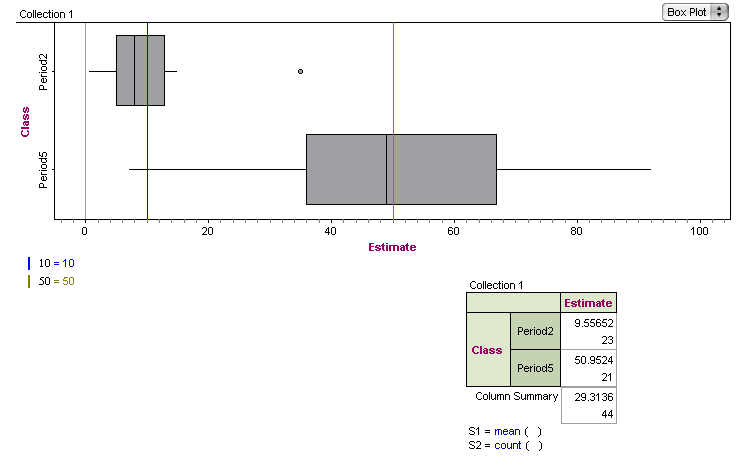
MORNING CLASS:
- Do you believe the population of Argentina is MORE or LESS than 10 million?
- Estimate the population of Argentina.
AFTERNOON CLASS:
- Do you believe the population of Argentina is MORE or LESS than 50 million?
- Estimate the population of Argentina.
Both classes gave me strange looks. But with instructions to answer as best they could, the students played along and provided data. Did you note the subtle differences between the two question sets? The two classes provide striking different estimates, due to the anchoring from the first question.
The inspiration for this activity comes from the book A Mathematician Reads the Newspaper by John Allen Paulos, which contains many other quick nuggets to use in your classroom. And now we have a rich conversation regarding the wording of poll questions to enjoy in the next few days!

4 replies on “Class Opener – Day 33 – Mind Control with 9th Graders”
[…] of my favorite aspects of Bob Lochel’s statistics blogging is how cannily he turns his students into interesting data sets for their own […]
I tried this activity today and here are my results.
https://docs.google.com/spreadsheets/d/1q0xcNZk9oQejSyLIu1fNhg_Cut_qsJ0PzZKb7gH2cHU/edit?usp=sharing
To be fair, my methodology was a bit different. First, we established the population of the U.S., and also compared the size of the two countries on Google Maps.
Thanks for the idea – used with two classes, students answering using clicker app at end of a different activity. Next day I went in with the data and created a dot plot first, then a dot plot with dots coloured by class group – it was easy to spot a pattern. We then created and discussed a boxplot as well as some descriptive statistics. Many students were swayed by the anchor question, but one commented that as I had shown a map of the world with Argentina highlighted before the anchoring question, she thought of the big area rather than the 10m prime. Good activity, interest and discussions – motivation for exploring data as well as designing questions
[…] measurement bias: Bob Lochel’s opener on the effect of a leading question. I did this as a Google Form: I assigned half the class a […]