Today’s opener was inspired by a movie correlations activity I have used in AP Statistics, and Cathy Yenca’s awesome activity which brings this idea down to the Algebra level.
For my freshman class, I wanted to students to “discover” the role of the correlation coefficient r – how it acts as a measure of the strength of the relationship between two quantitative variables. To begin, 10 potential vacation / off-day activities were listed on the board:
- Ski
- Go to Beach
- Amusement Park
- Baseball Game
- Broadway Show
- Camping
- Washington DC Tour
- Shopping Day
- Big Concert
- Cruise
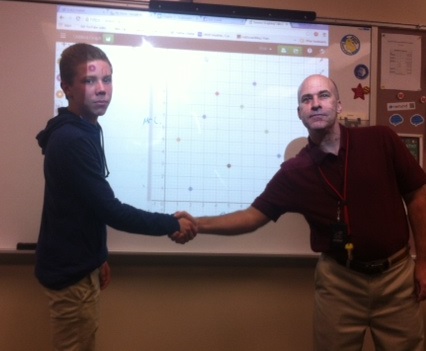
Students were each asked to rank these activities from 1 to 10 (10 being most desirable) and using each number only once. The class then moved into partnerships with my suggestion that they work with someone they maybe did not know so well in class, and compared results. With an odd number of students, I worked with a student to share interests. Results for each activity were plotted as ordered pairs, with each partner contributing their number score. Students plotted their points on graph paper, while my student partner and I used Desmos – and quickly discovered that we have little in common.
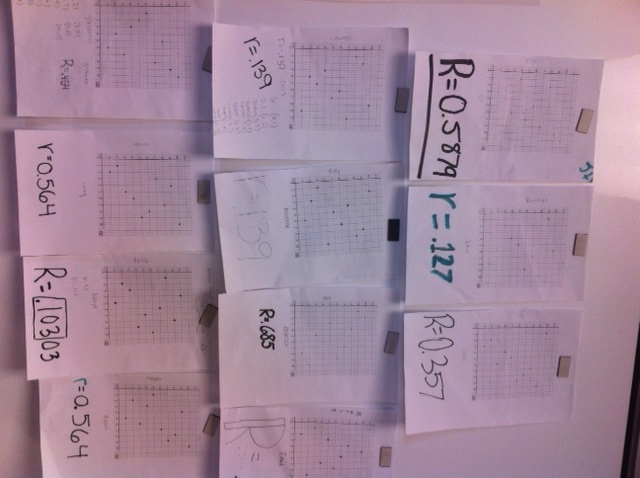 From there, students learned how to use graphing calculators to analyze the data – making the scatterplot and finding the best-fit line. The partnerships also wrote this mysterious new statistic – r – on the bottom of the graph and shared their graph in the board. Through a gallery walk, the class examined the graphs and tried to conjecture the meaning of r.
This worked better than planned, as the class quickly made some key observations:
- Pairs with stronger relationships have “higher” r values.
- There are no r-values greater than 1.
- r can be negative if people answer opposite each other.
Definitely will add this activity to my arsenal every year!
If you are interested in the activity for AP Stats, you can check out the Google Form we use, then some instructions for processing the data in this video:

4 replies on “Class Opener – Day 38 – Are Any of My Students Compatible?”
[…] Compatibility Survey […]
[…] linear correlation: Bob Lochel’s Friendship Compatibility Test. I loved this one. I wrote a Python program to match students up randomly (I try to get my students […]
Hey,
I love this activity. I feel as though my students can find the r value but struggle to remember what it represents. I am hoping this activity will help. I have some questions before I implement it:
How did you introduce Line of Best Fit with the Calculator in this activity? Did they have directions on paper. Did you teach the class?
Do you have any handouts for this you could share?
Thanks so much,
Abby Adcock
Abby, below is a video which explains how to do regressions with desmos, and this is how I work through it in class. I don’t have a handout handy, as we are now 1-1 and complete many items on OneNote. But I just give students the lists and brief instructions. https://www.youtube.com/watch?v=ihj9D1zPtwg