We’re moving through our algebra review, and today is absolute value day! I’m not sure the students are as thrilled about this as I am –

My students have seen absolute value equations and inequalities before, mostly as a stand-alone unit with a series of special rules to memorize. But I find that students have rarely been asked to think about solutions to inequalities as the comparison of values between two functions. So instead of re-hashing some old rules, let’s fire up the netbooks and look at some graphs!
 The Desmos desmonstration here (it’s clickable) allows students to experiment with the parameters of an absolute value function, and compare to a constant function. Before diving into some specific problems, I allowed a few minutes for partnerships to play and try to summarize any relationships they saw. Very few saw an immediate link to what we have already been working on – inequalities – and the best was yet to come.
To start thinking about specific inequalitiy problems, I asked students to set the sliders so that they represent the following problem:

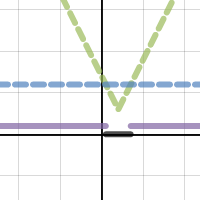
The graph then lets us analyze the relationship between the absolute value function (dashed green) and the constant function (dashed blue).

Time to find out if my students see the link between the graphs and the inequality. Groups were given 2 minutes of “table talk” to discuss:
How does this graph allow us to find solutions to the given inequality?
This was not a quick discussion. Many students were eager to participate and provide ideas, but many went back to pencil and paper, rather than analyze the graph. Soon, with some students approaching the board, links beween the green and blue functions were found. But, if scaffolding is needed, think about these prompts:
- When is the green “above” the blue? What does this indicate?
- When is the green “below” the blue? What does this indicate?
- Where do the green and blue intersect?
Finally, students began to understand the meaning of the black and purple lines on the graph – representations of the “greater than” and “less than” solutions sets.
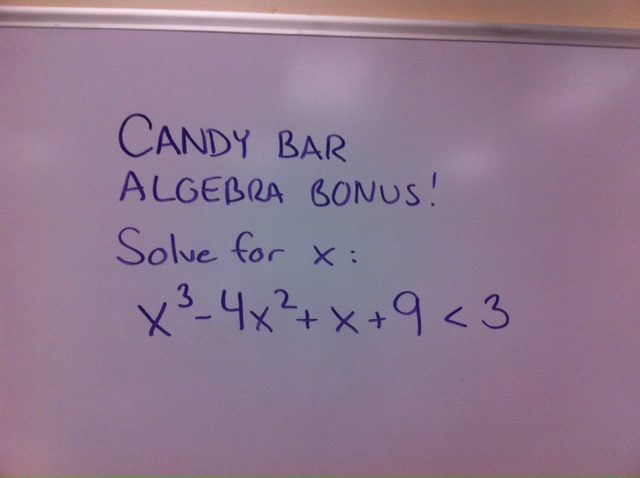
In the end, I find that using technology to analyze the visual relationships between functions allows for a deeper understanding than algebraic maniupulation alone. Yet, I am often surprised when students don’t know that this is a valid (not “cheating” or somehow dirty) method of solving an equation. To assess what parts of this lesson “stuck”, I plan to give the following opener tomorrow. Solve for x:

Wondering how many will immediately whip out Desmos on their cell phone….hoping they do!