Today begins out probability chapter in AP Statistics, which is often deceptively tricky for students. Until now, probability has meant simple experiments – drawing cards, flipping coins or picking marbles from urns (why are we probability folks always so fixated on urns, anyway?). Thinking about probability as a long-term proportion of success is a foreign concept, and separating short-term “bad luck” from a suspected effect requires much deeper understanding. Here is one of my favorite openers to start conversation about short-term probability, which is adapted from an activity done in a college statistics course.
CAN I DETECT PSEUDO-RANDOMNESS?
 Students are separated into teams of 2 (or 3). 5 minutes are on the projected clock, and each team is given a grid with 50 squares, along with instructions, face down. Students are told that I will leave the room for exactly 5 minutes, during which time they are to complete the instructions. At the end of 5 minutes, I will return to the room (after enjoying my coffee) and class will commence. All instructions are expected to be followed precisely, and without talking to other teams.
In the room, there are two sets of instuctions, which I have passed out without knowing who received which. The instructions are mostly similar, but with an important difference:
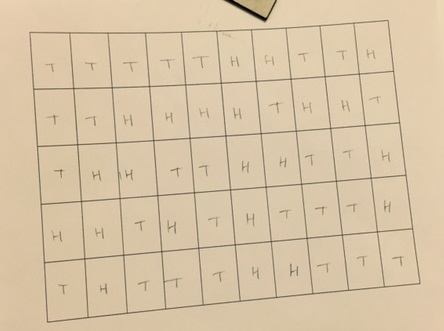
TEAM 1: YOUR JOB IS TO USE YOUR GRAPHING CALCULATOR TO SIMULATE A COIN BEING TOSSED 50 TIMES. USE THE COMMAND “RANDINT (1,2)” TO GENERATE RANDOM DIGITS. LET 1 BE HEADS AND 2 BE TAILS. RECORD THE COIN TOSSES IN ORDER, USING H’s AND T’s, IN THE GRID PROVIDED. DO NOT WRITE ANYTHING ELSE ON YOUR GRID PAPER WHICH WOULD IDENTIFY YOUR GROUP. WHEN YOUR GROUP IS DONE, BRING YOUR GRID TO THE FRONT BOARD AND ATTACH IT WITH A MAGNET.
TEAM 2: YOUR JOB IS TO GENERATE A SEEMINGLY RANDOM STRING OF 50 COIN TOSSES. GOING AROUND THE GROUP, HAVE EACH MEMBER SAY “HEADS” OR “TAILS”, IN ORDER TO COMPILE A SEMI-RANDOM SEQUENCE. RECORD THE RESULTS IN ORDER, USING H’s AND T’s, IN THE GRID PROVIDED. DO NOT WRITE ANYTHING ELSE ON YOUR GRID PAPER WHICH WOULD IDENTIFY YOUR GROUP. WHEN YOUR GROUP IS DONE, BRING YOUR GRID TO THE FRONT BOARD AND ATTACH IT WITH A MAGNET.
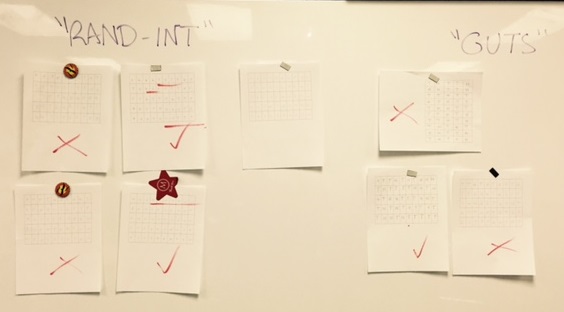
So, one group tosses “real” coins, while another group tries their best to act randomly. When I came back to the room, 8 sheets were hanging on the board. Without comment, I write “RandInt” and “Guts” on the board to indicate the two methods, and now the challenge is on: can I successfully separate the “real” from the “fake”? As I examine the papers, and slide them into their groups, students begin to sense what I am up to as I hear groans , cheers and grunts…but I don’t want to know who is who yet. I am sometimes quite good at separating these, but some days I over-think things or believe that a group or two may have sabotaged the experiment. So, what I am looking for here?
- Runs of heads or tails: the probability of a run of 5 heads (or tails) in 50 coins is 55%, verified with Wolfram. Usually, non-random students will not let a run go beyond 3, maybe 4.
- Alternating starting behavior: my hypothesis is that if a group is developing a pseudo-random string, they will alternate often at the start.
For the class, this becomes a rich discussion about short-term versus long-term behavior. That while we can expect a group of 50 tosses to settle to about 50/50 heads and tails, the short term can yield surprises. And how long of a string should cause us to begin to suspect something is amiss, versus a natural occurrance?
So, how did I do this time? Unfortunately, not so hot. But that’s OK.

Asking kids what they thought I was looking for led to many of the big ideas of the section I was looking for, and we were off and running into our probability chapter!
 There was one paper I really struggled over, as it started with 5 consecutive tails. While my guidelines should have clearly placed this into the “randint” group, my suspicion was student sabotage. But it was RandInt all the way….even short-term events can fool the instructor.
One student in my colleague’s class then summarizes the entire activity quite nicely, and also provided a needed Friday dose of comic relief:
The calculator gives you runs
Well, if it’s a TI, maybe…