Shared worked problems! What a magical time to be alive! What wonders does the magic algebra worksheet have for us to enjoy today?
OK….so most shared work problems suck. I apologize to my students aspiring to be pipe organ re-varnishers, but we can do so much better.
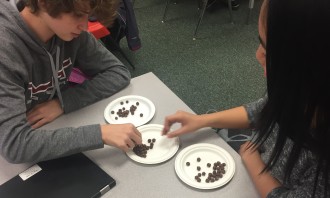
This week I used Cocoa Puffs, stopwatches and Desmos to bring some engagement to my rational expressions lessons. To start, each student was provided with a plate filled with 30 grams of Cocoa Puffs (incuding the plate) . After my 3-2-1 countdown, students picked Puffs one at a time from the plate and tossed them onto an empty plate. As they completed the task, times were recorded for each student.
After students finished, I had them partner up and consider the question: “if you worked together with your partner on this task, with one plate of Cocoa Puffs, how long would it take you?”
Students asked a number of clariying questions (yes, there is one plate. yes, you can pick them off the plate together.), partnerships developed a few ideas. We debated the validity of many of them:
- Many groups took the average of the two times, then divided the result by 2. This seemed reasonable to a number of groups, and led to a discussion of the vavlidity of averaging rates.
- Some groups attempted to find a rate per gram. This was a good start, but given that groups did not know the mass of the plate (I use Chinet, so it’s bulky!), this introduced some guesswork.
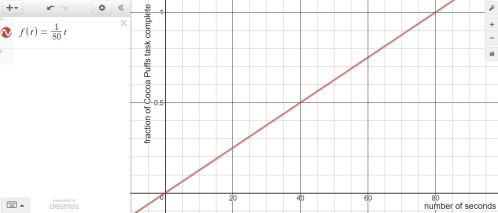
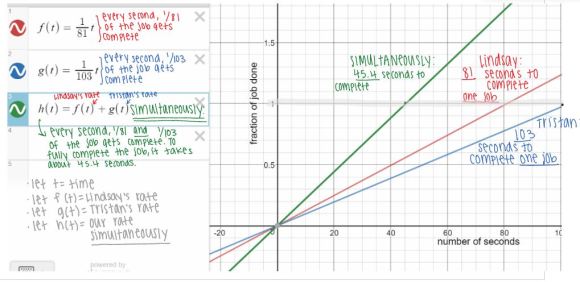
To steer discussion, we focused on one student who took 80 seconds to complete the task. How much of the job did they complete after 40 seconds? After 20? Can we write a function which depends on time here? What does it mean? Crossing the bridge from the task time (80 seconds) to the job rate (1/80 per second) is a tricky transit. Using Desmos to show the “job” function lends some clarity.
From here, many partnerships felt more comfortable with establishing their own estimates. The next day, teams shared their work and estimates on OneNote, then peer-assessed the communication. Some of the work was wonderful, well-communicated, and served as a model for the class to emulate.
 The next day, we listed our calculated shared work predictions on the board, and tested our estimates. Teams timed each other with cell phone stopwatches, and did not let participants see the clock until the task was complete.
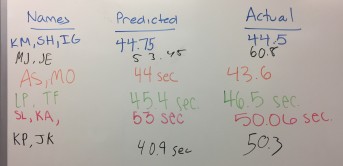
Many groups were quite close to their calculated predictions! We discussed why our predictions didn’t quite meet the actual – bumping, variability in mass, general panic – and when error is acceptable. And now we have a firm background in rates and rational functions – time to conquer those pipe organs!
