Categories
Uncategorized

Today, Nothing Worked Well…and That’s OK

My 9th grade class has a quiz on statistics concepts tomorrow – standard deviation, interpreting graphs, outliers and the normal distribution. It’s a real cornucopia of stats ideas! To review, today’s class goal was to collect class-wide data using a fun applet, share using the collaboration space in OneNote, use a website to assess the data, and write our statistical summaries. A fun day filled with stats fairies and pixie dust! Here was the lineup:

  • shapes
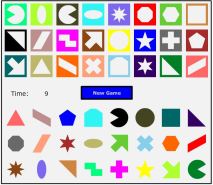
Collect data using Shapesplosion – an online game (think the old Perfection Game) developed by folks from Grinnell College. The plan was to play with, and without color. Aside: it’s OK if you disappear for a while to play with this site, it’s super-fun!
  • Share data using the collaboration space on OneNote.
  • Use the artofstat.com web apps to make graphs and produce statistical summaries.

This is what I had in mind….Here’s what really happened

  • Shapesplosion didn’t work – while I rehearsed the site on my laptop, it didn’t work for the kids. It was a Flash issue, and stopping to figure this out wasn’t in the cards. After a few minutes of hemming and hawing, I settled upon a far less fun data collection idea: Tell me a temperature you deem “cold” when you go outside, and one you deem “hot”. Not nearly as sexy as the time data I wanted…but hey, I needed a data set.  But at least we have data until…..
  • ArtOfStat was glitchy and wasn’t playing nice with copy/paste from OneNote. Kids are getting restless, we haven’t done much stats review, and I am definitely starting to lose my “big” class.

manuel.gifSo, what do you do when a lesson goes south, your objective is slowly slipping away and the kids smell chum in the water?

Remember:

It’s not the kids’ fault when your plans go kaput. You may feel like some yelling is in order, but breathe, calm down, and be honest about what went wrong.

Student learning can’t be compromised because things go south. “There’s no time” is an easy out when we get rushed, but maintaining lesson fidelity is far more important than rushing to get to “stuff”.

Maintain clear expectations. Eventually all of my students were able to review some, and I had to alter my plan of attack. But stopping class, making sure we were all on the same page and understood the statistical expectations was necessary.

It won’t be the last time stuff goes wrong….roll with it…and laugh along with it.

Categories
Uncategorized

Cocoa Puffs and Shared Work

Shared worked problems! What a magical time to be alive! What wonders does the magic algebra worksheet have for us to enjoy today?

organ

OK….so most shared work problems suck. I apologize to my students aspiring to be pipe organ re-varnishers, but we can do so much better.

This week I used Cocoa Puffs, stopwatches and Desmos to bring some engagement to my rational expressions lessons. To start, each student was provided with a plate filled with 30 grams of Cocoa Puffs (incuding the plate) . After my 3-2-1 countdown, students picked Puffs one at a time from the plate and tossed them onto an empty plate.  As they completed the task, times were recorded for each student.

After students finished, I had them partner up and consider the question: “if you worked together with your partner on this task, with one plate of Cocoa Puffs, how long would it take you?”

Students asked a number of clariying questions (yes, there is one plate. yes, you can pick them off the plate together.), partnerships developed a few ideas. We debated the validity of many of them:

  • Many groups took the average of the two times, then divided the result by 2. This seemed reasonable to a number of groups, and led to a discussion of the vavlidity of averaging rates.
  • Some groups attempted to find a rate per gram. This was a good start, but given that groups did not know the mass of the plate (I use Chinet, so it’s bulky!), this introduced some guesswork.

To steer discussion, we focused on one student who took 80 seconds to complete the task. How much of the job did they complete after 40 seconds? After 20?  Can we write a function which depends on time here?  What does it mean? Crossing the bridge from the task time (80 seconds) to the job rate (1/80 per second) is a tricky transit. Using Desmos to show the “job” function lends some clarity.

desmos graph

From here, many partnerships felt more comfortable with establishing their own estimates.  The next day, teams shared their work and estimates on OneNote, then peer-assessed the communication.  Some of the work was wonderful, well-communicated, and served as a model for the class to emulate.

student work

puffs
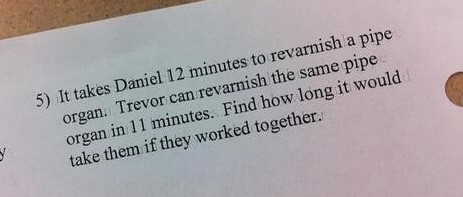
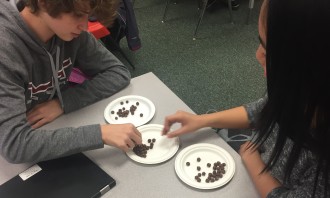
The next day, we listed our calculated shared work predictions on the board, and tested our estimates. Teams timed each other with cell phone stopwatches, and did not let participants see the clock until the task was complete.


data

Many groups were quite close to their calculated predictions! We discussed why our predictions didn’t quite meet the actual – bumping, variability in mass, general panic – and when error is acceptable. And now we have a firm background in rates and rational functions – time to conquer those pipe organs!


Categories
Uncategorized

I Built a Crappy Digital Activity…Here’s How I Fixed It.

In the past 3 years, I have used Desmos Activity Builder in a number of different ways in my classroom: to introduce new ideas, as a formative assessment tool, and to allow students to “play” with mathematical ideas through Polygraph and Marbleslides. An activity I developed last year and re-built this year reminded me of two ideas I need to keep on my radar at all time. First, building an effective classroom activity is really, really hard.  Second, don’t be stubborn in evaluating an activity – it pays to be brutally honest.

races.JPG
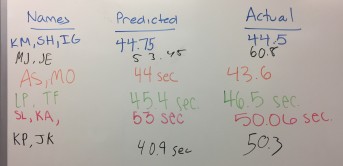
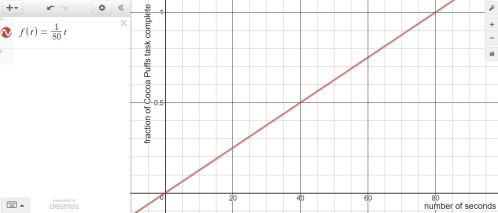
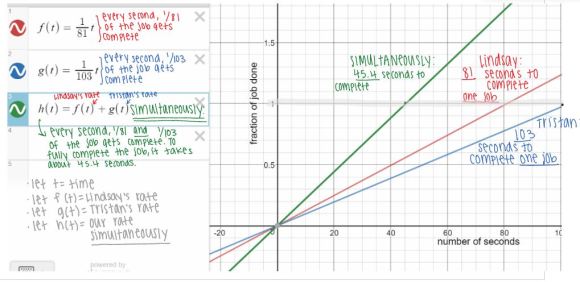
For my 9th grade class last year, I wanted an activity which would cause students to think about variability in data distributions, and introduce standard deviation as a useful measure of variability. You can preview the activity here.  Take a few minutes, test drive it, and see if you can suss out the problems.

So, what went wrong.  Well, a number of things – but here are the two primary suspects.

  1. It’s too damn long! It takes way too long to get to a working definition of standard deviation, and by screen 14 students are all over the place.  Using student pacing could help remedy some of this, but I found much of the class losing interest by the time we got there.
  2. I was stubborn! I was looking for a “cute” visual way for students to think of standard deviation as “typical distance from the mean”.  In my zeal to hammer this working definition home, I tried to build slick graphs which lost many students.

6 millionHow to fix it – last year, the Desmos teaching faculty developed the “Desmos Guide to Building Great Digital Activities“.  It’s worth a read (and a re-read) now and then to guide activity construction. In my variability activity, this bullet point from the guide resonated with me: Keep expository screens short, focused, and connected to existing student thinking.  In many of the screens, I over-explained things.  Students don’t want to read when they are completing a digital activity, they want to investigate, create, and explore.  I robbed them of that chance.

citiesToday I tried my new, rebuilt variability activity with 2 classes (slimmed down to 12 screens from 19), and there was a vast improvement in class engagement. There were more opportunities for students to express their ideas regarding comparisons of distributions, and we had plenty of time to pause, recap, discuss and think about next steps.  A number of points from the Desmos Guide drove my thinking:

Ask for informal analysis before formal analysis.  While I kept in the “typical distance” definition of standard deviation, it was only in a small way – we’ll move on to a more formal definition next. Students were able to conceptualize standard deviation as a useful measure, and now can move on to a formal definition.  My old activity felt too “sledge-hammer-ish” and I knew it.

Incorporate a variety of verbs and nouns. I provided a number of ways for students to think about variability and distribution comparisons in the early screens, and strove to build different-looking screens.  This kept the ideas fresh, and students talked with their partners to assess these differences in different ways.

Create activities that are easy to start and difficult to finish.  In the last 3 screens, I ask students to extend their thinking, be brave, and apply new ideas.  For those students who got this far – most did, these screens elicited the loudest debates.  We ran out of time at the end, but we have some good stuff to build off of tomorrow morning.

I’ve learned that it’s important to be honest about an activity.  It’s easy to blame the students when something goes wrong, especially which class heads away from learning and towards frustration.  But performing an activity autopsy, focusing on clear goals, and keeping the design principles in mind is helpful to move an activity forward.