Categories
Statistics

An Egg-Cellent Simulation

The scenario I used for a fun lesson with my 9th graders this week comes from a talk by James Bush from Waynesburg College, which I attended at the US Conference on Teaching Statistics in May.  James is a master of finding clips from TV and movies to use in his class to encourage discussion, and this clip from the Jimmy Fallon Late Show features a game called “Egg Russian Roulette”. I have embedded a clip here, but you can search for many times Jimmy played this game on his show.

For James’ college statistics courses, this clip is a helpful opener to the hypergeometric distribution, where we are interested in multiple successes from draws done without replacement.  While this setting could eventually be presented to my AP Stats students, it lives a bit outside of the scope of what we do at the college level. But there are some strong entry points for discussion with my 9th graders, including probability trees, conditional probability, and simulation.

PLAYING THE GAME IN CLASS

Before showing the video, two volunteers were called to participate in a mystery game.  The two student volunteers became a bit nervous over their decision when a carton of eggs was produced, eventually shown to be filled with plastic eggs (awesome idea by James!). My first chance to try this with volunteers on my own was at Twitter Math Camp in June, and lots of fun tweets followed.

Thanks to Richard Villanueva, who recorded many of the My Favorites from Twitter Math Camp, we have coverage of the ganeplay.  Check out all of the videos of My Favorites from TMC15 on his YouTube Channel.

Next, I asked the class to think of questions they have about the game they saw, or in general about Egg Roulette.  A good starting list developed:

  • How likely is it that Tom Cruise would lose that quickly?
  • Once Tom picks a raw egg, how likely is it that Jimmy is safe on his draw?
  • Is it better to go first or second?

Photo Sep 18, 8 06 14 AM 
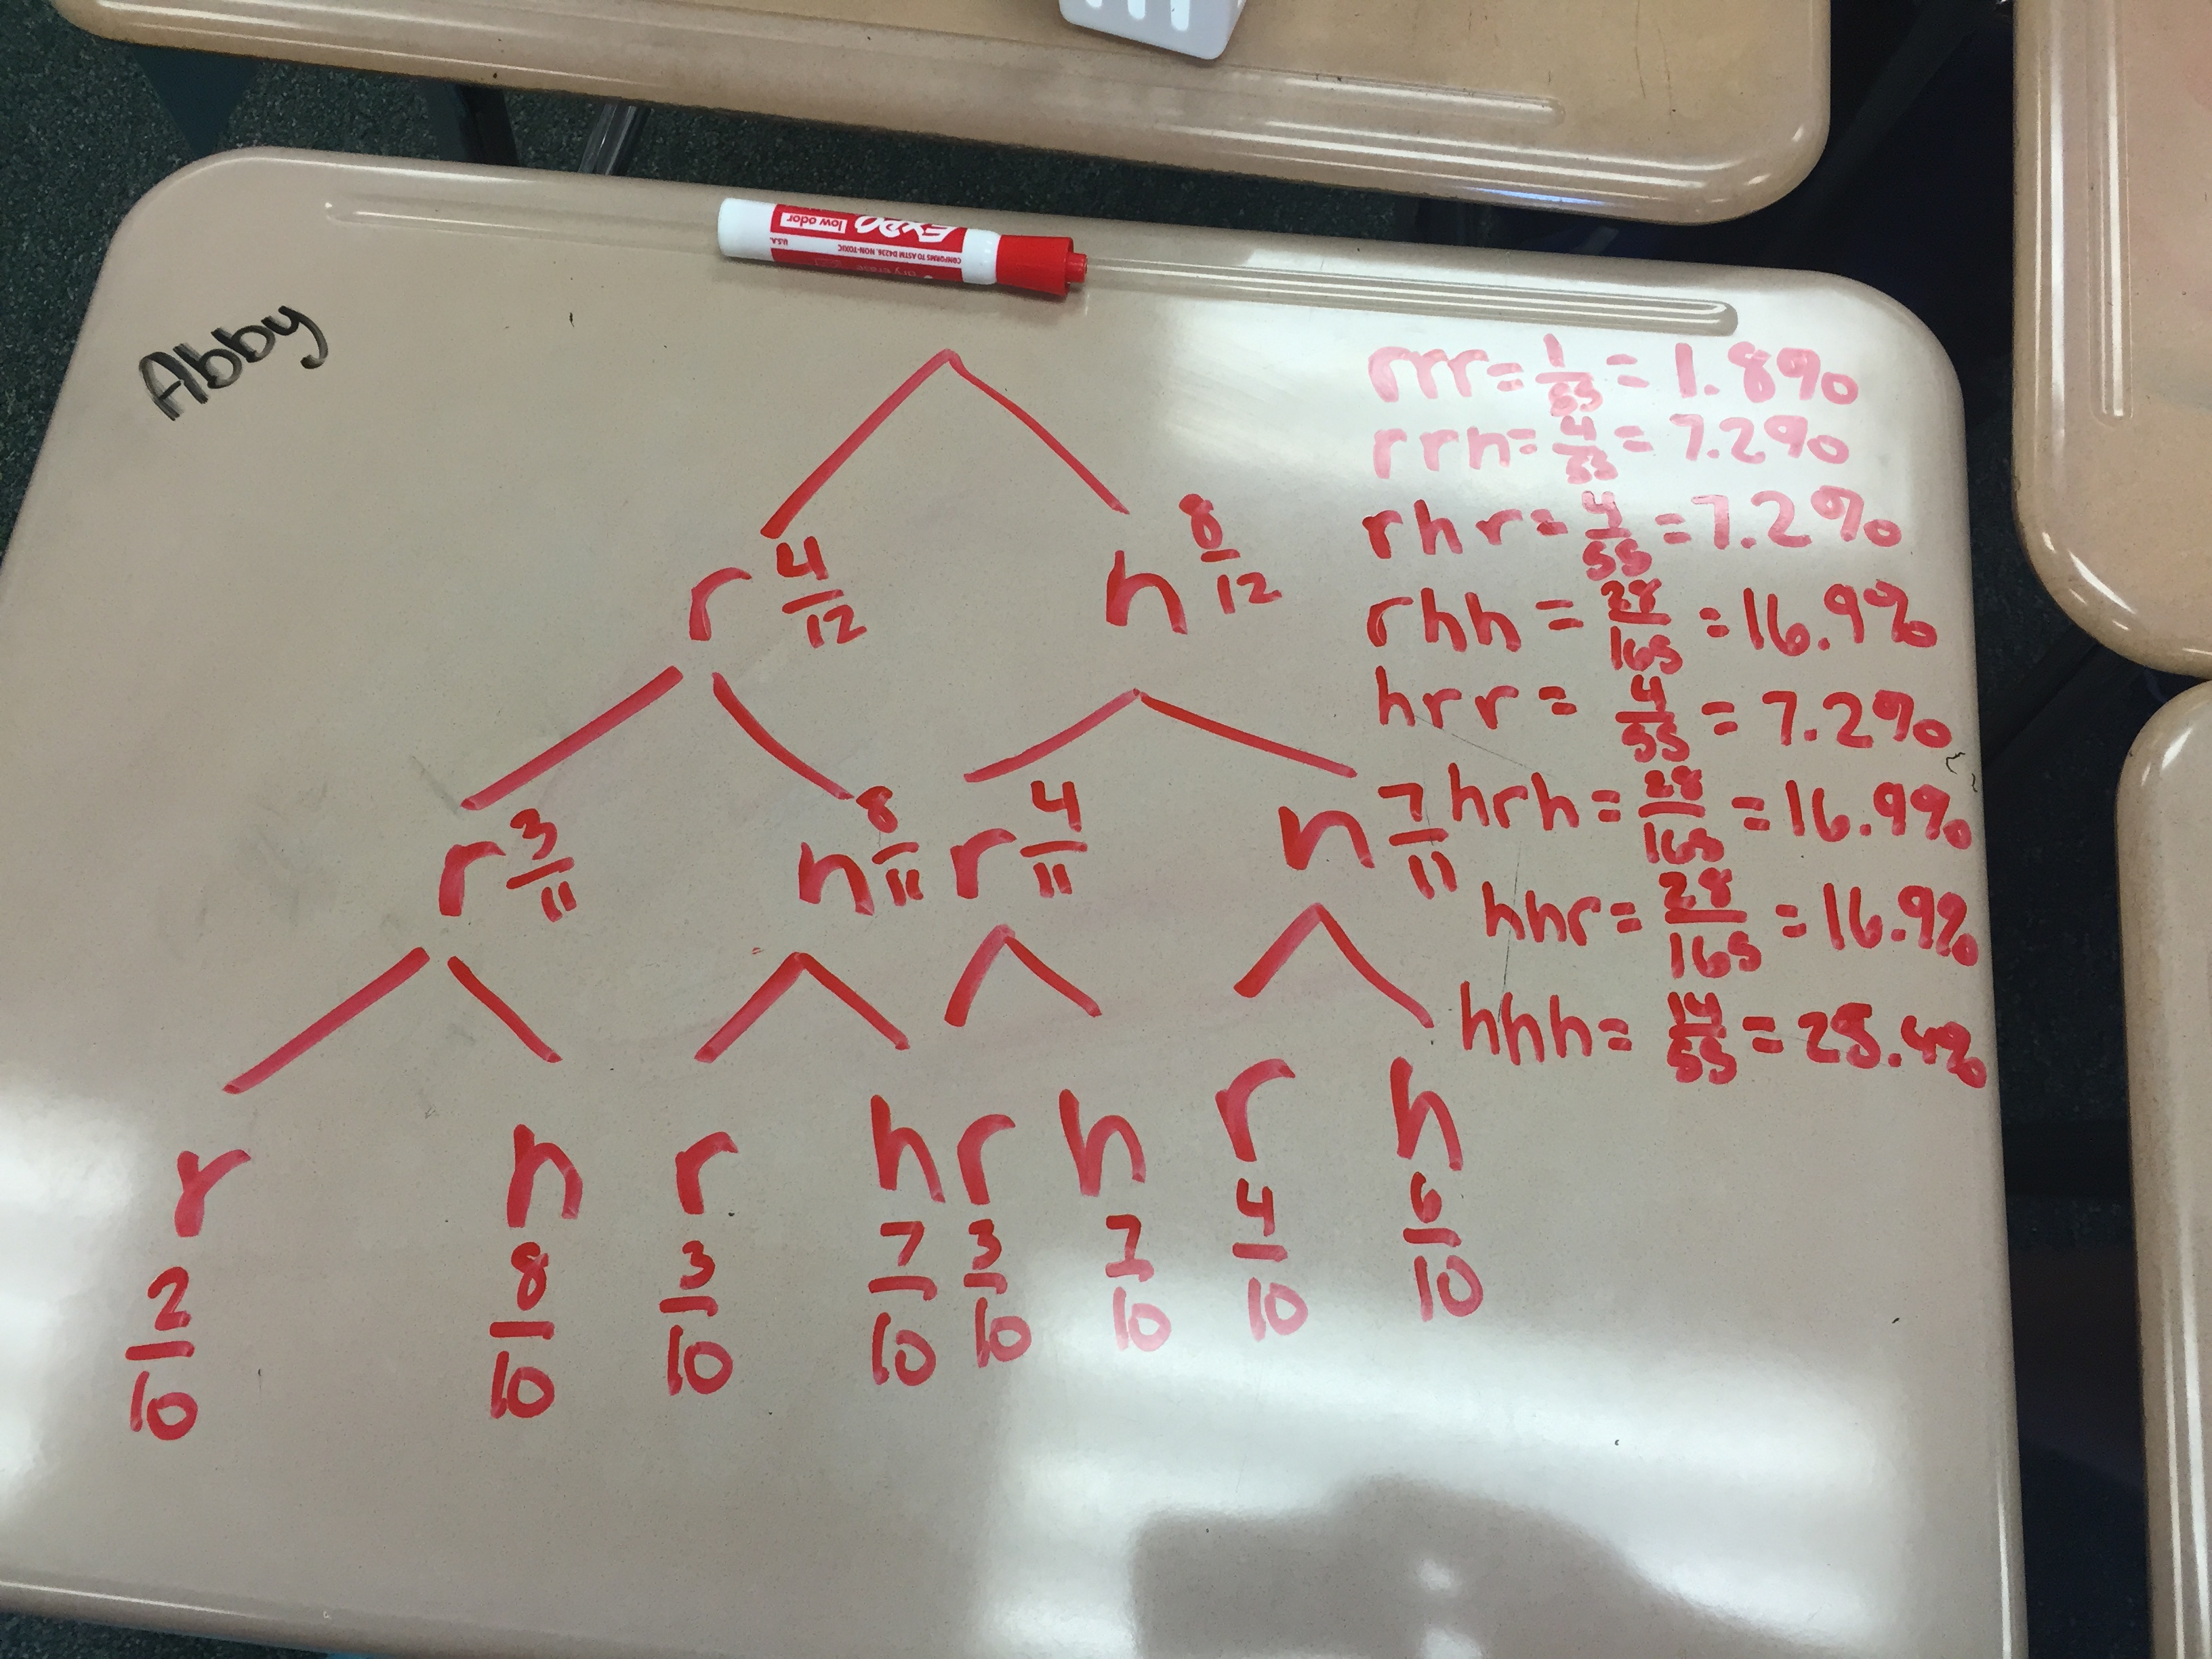
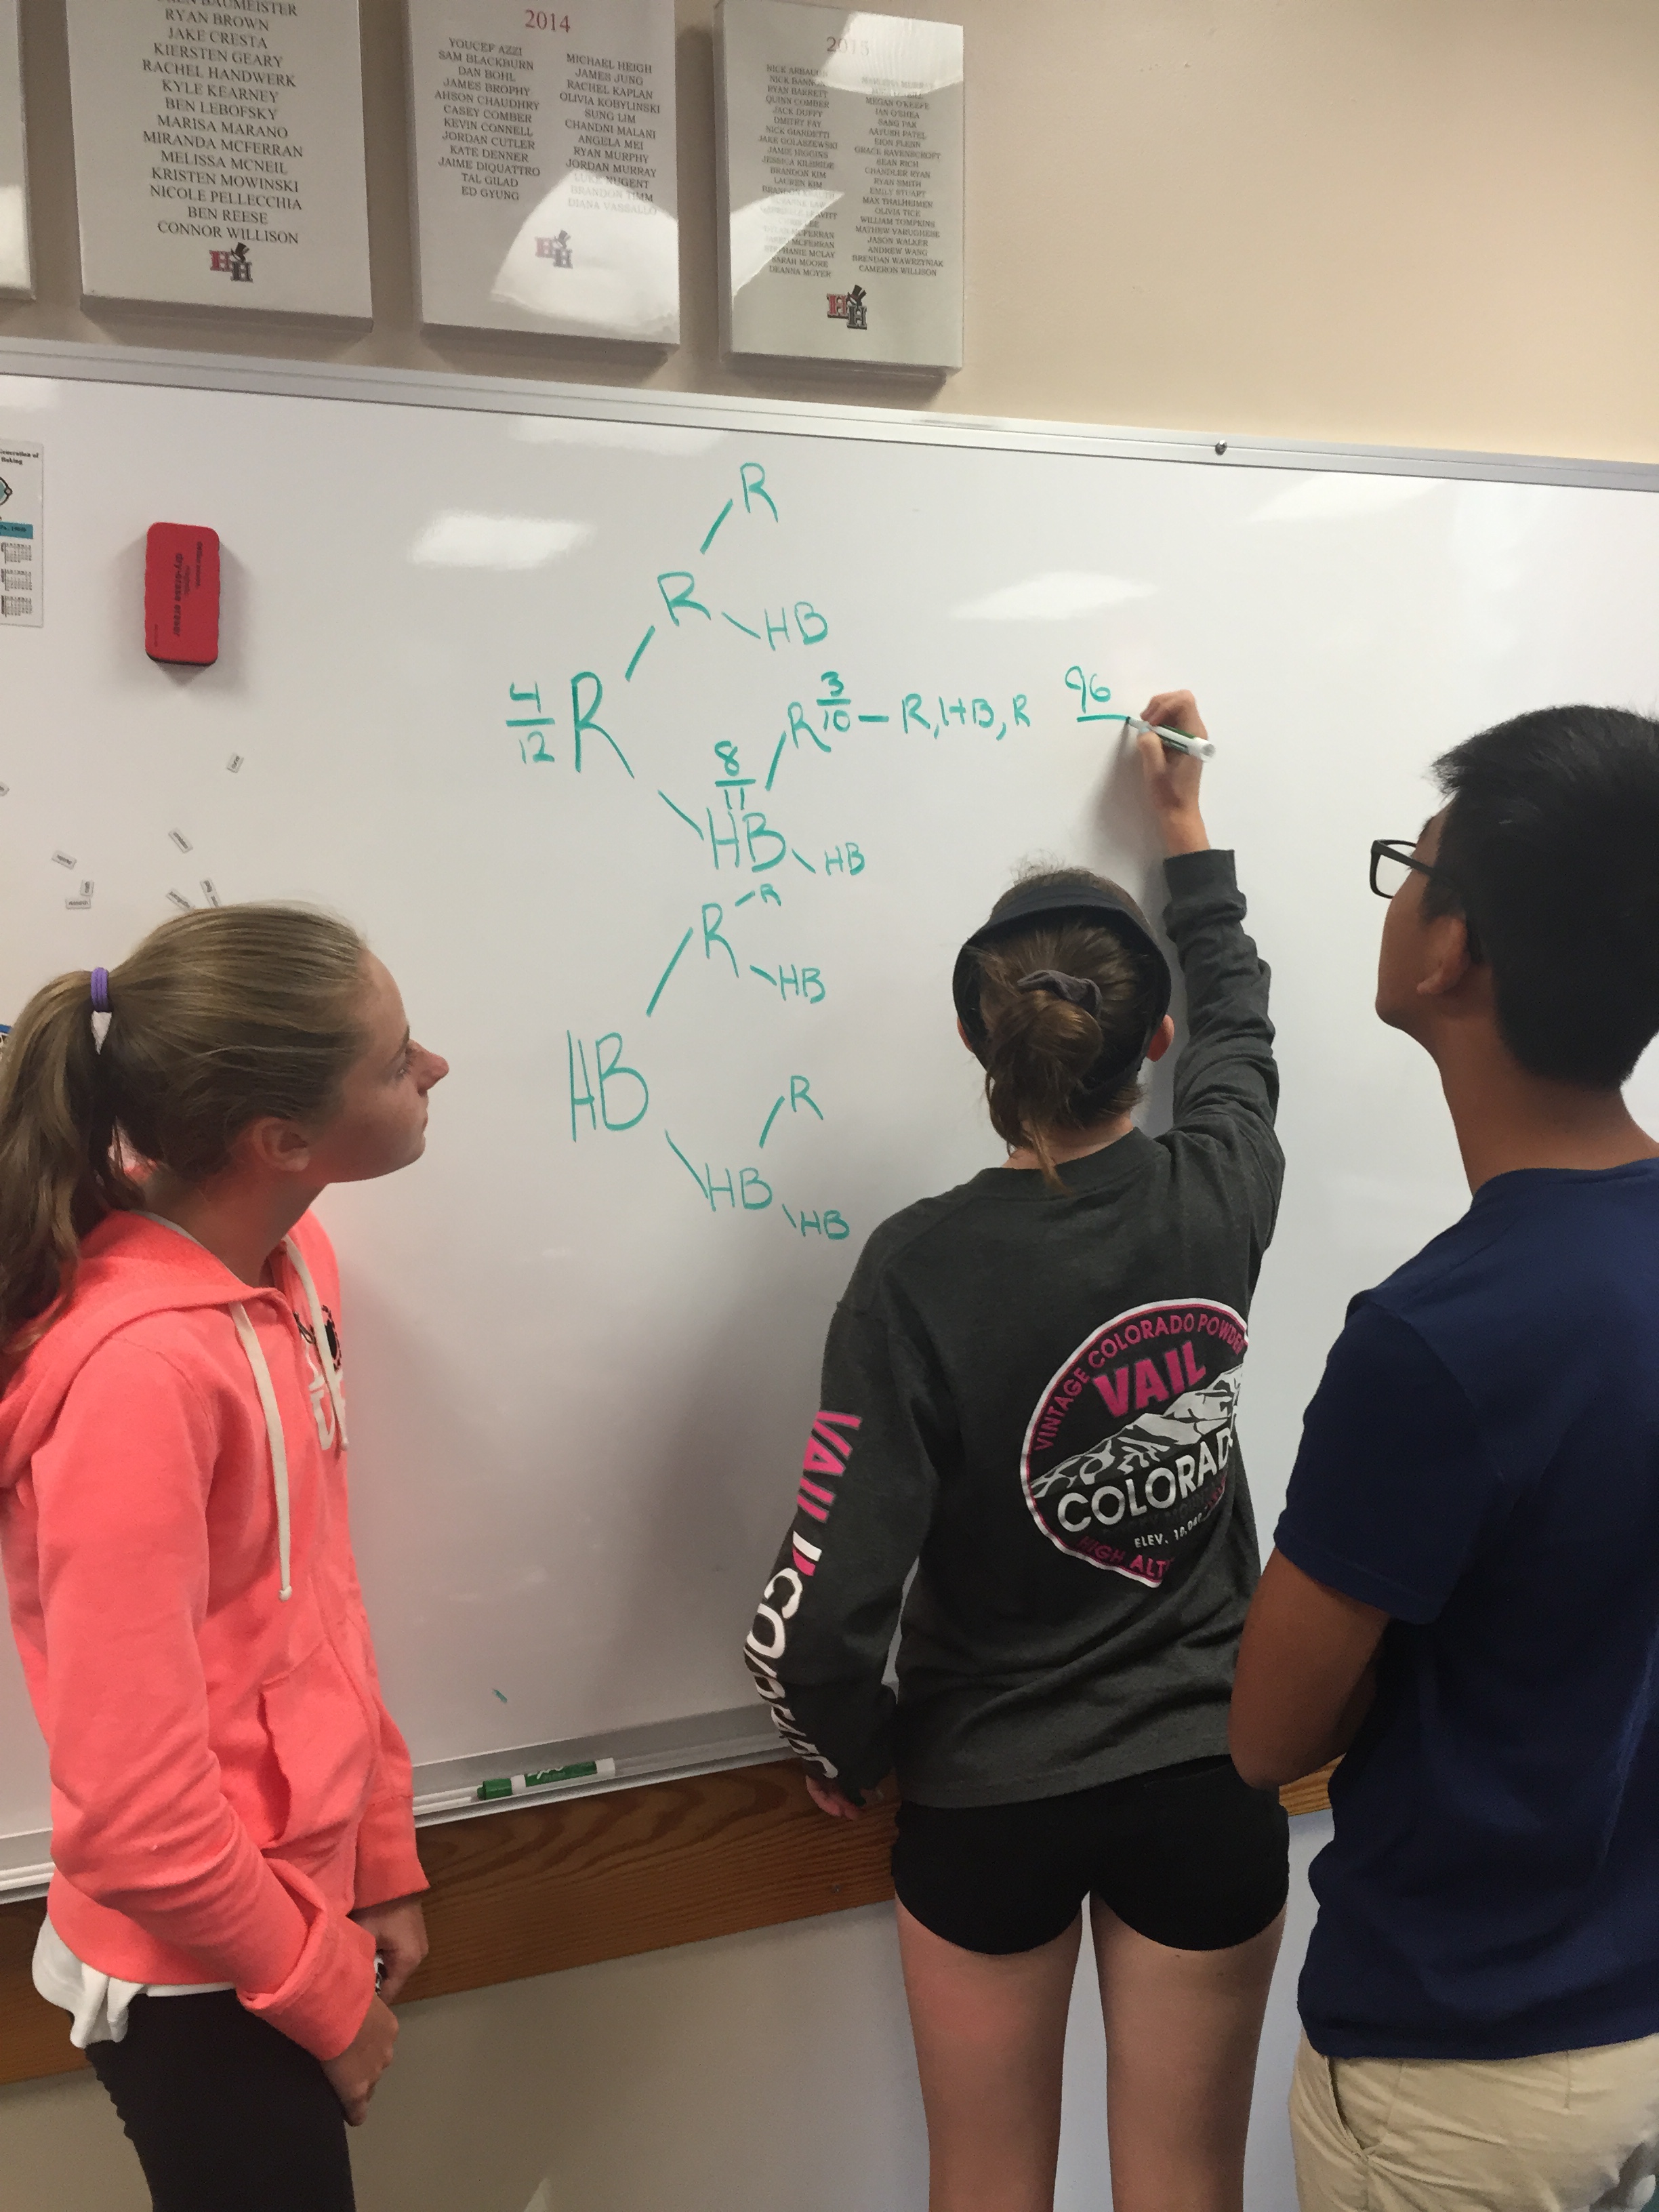
I then challenged my student groups to sketch out the first three rounds of egg roulette, and find the probability of Tom losing in 3 rounds. We had worked on trees the day before, and this game presented a good chance to apply what we had discussed earlier.

Photo Sep 18, 8 13 52 AM

SIMULATION

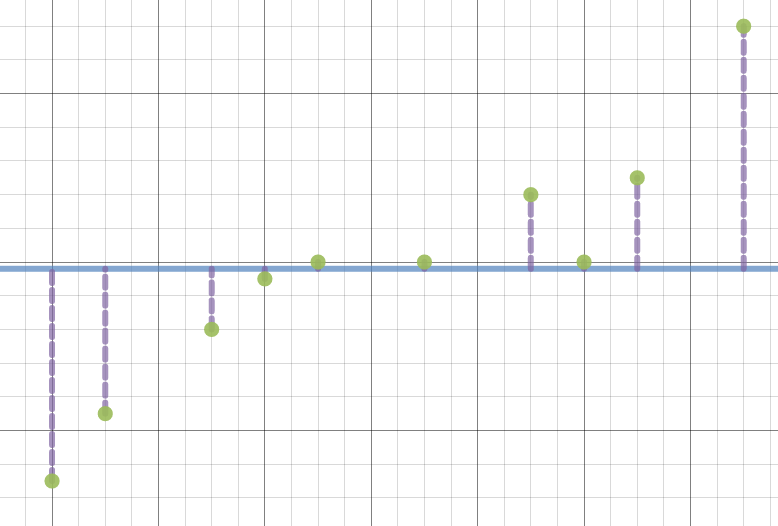
After our analysis of the first three rounds, the conversation then moved to strategy: is it better to go first or second, or does it not matter?  Our “gut reaction” poll revealed that “it doesn’t matter” was the most common response, with “go first” was in second place.  The thought behind going first is that you could easily draw a hard-boiled egg, and thus put pressure on the other player.

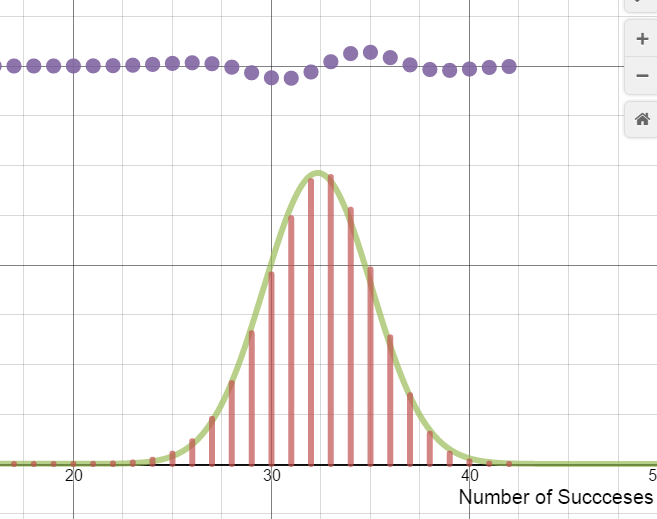
To simulate the game, pairs of students were given one suit from a deck of cards.  The ace was moved aside, leaving 12 cards (representing the 12 eggs).  The 10, jack, queen and king then  represent raw eggs.  After shuffling the cards, students dealt cards into two piles, Tim and Jimmy. When a player was dealt two raw eggs, the game ends and the result recorded.  We were quickly able simulate over 50 plays of Egg Roulette, and the class results were recorded.

Egg Simulation

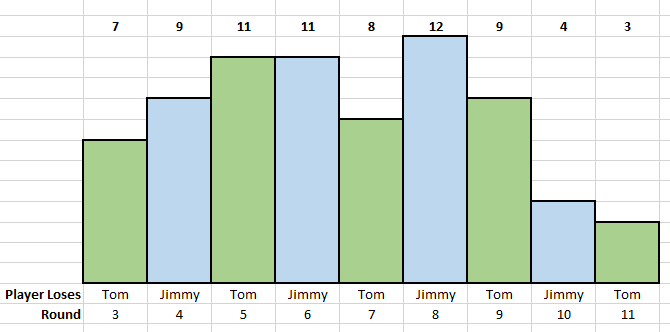
One student quickly identified, and then defended, that the game can NEVER go the full 12 rounds.  Also, some students noted that the second player (here, Tom) has one extra opportunity to lose the game.  A second straw poll revealed that student perceptions on the game had shifted – few thought it was a 50/50 game, and many saw that the first player held a disadvantage.

FOLLOW-UP

In teams, students are now challenged to explore a similar (yet shorter) Egg Roulette game, compute theoretical probabilities, conduct a simulation, and analyze the results.  I’m looking forward to some interesting-looking trees.  The document here shows guidelines for this activity, some assignment ideas, and a full tree for the first 3 rounds of Egg Roulette.

Download the document

View this document on Scribd
Categories
Statistics

Desmos Lessons for AP Statistics

In the past year-plus, Desmos has added useful features to help those of us in the statistics world. The elegant addition of regressions (check out my tutorial video) has been a welcome new feature, and simple stats commands have also been added for lists.  Here are 3 Desmos creations which will become part of my classroom lessons for the 2015-16 AP Stats year.

THE COEFFICIENT OF DETERMINATION

That dreaded r-squared sentence…..yep, the kids need to memorize, but let’s add some meaning behind the “percent of variation due to the linear relationship….blah blah blah…” mantra.  Here’s an activity I do with my classes which has helped flesh out this regression idea.  To start, every student is handed a card face down with a prompt.  On my signal, the students turn over the card and respond to the prompt, with specific instructions not to discuss their response with classmates.  Here’s the prmopt:

An adult male enters the room. Estimate his weight.

After some nervous mumbling, I now hand out a second prompt card, and we will repeat the process.  But this time the card looks a little different.

An adult male who is {*see below} tall enters the room. Estimate his weight.

This time, I have 6 different versions of cards, and they are randomly scattered about the room.  Some cards say “5 feet, 6 inches” for the height, with other cards for 5’9″, 6’0″, 6’3″, 6’6″ and 6’9″.

After responses for both cards have been given, the responses are written on the board, along with the associated heights for the 2nd round of cards.  How did the background information given in the 2nd set of cards influence our responses?  Now the bait has been set to look at the Coefficient of Determination on Desmos.

rsqr1In this Desmos, heights and weights of adult males are given in a scatterplot. Activating the first folder – “using the mean of y1 for prediction” shows us the mean of all weights, and associated errors if the mean weight were used to predict for all men. The folder is activated by clicking the open circle to the left.

rsqr2Next, we can explore how the regression line helps improve predictions. Click the “LSRL and explained variation” folder and note the reduction of error.  The calculation for r-squared as the reduction of error is given, and can be compared to the calculated r-squared value from the regression.  Also, points in the scatterplot are draggable – so play away!

THE MEAN-MEAN POINT IN REGRESSION

I have done this exploration of regression facts for many years, using worksheets from Daren Starnes along with Fathom. I find this Desmos version to be much easier for kids to handle, and it can be saved for future discussion.  And while in this demonstration I have all of the commands prepared for you, I would walk students through entering the commands themselves in class.

lsrl1First, we have a scatterplot with its LSRL included.  Activate the “mean of x and y” folder” and notice the intersection of these value lines. Here, the points are all draggable, so we can easily generalize that all LSRL’s pass through the point x-bar, y-bar.

lsrl2The second discovery is a bit more subtle.  Click the next folder, and now we have new lines 1 standard deviation in each direction for x and y.  Clearly, our intersection point is no longer on the LSRL, but what is its significance?  How far do we rise and run to get to this new point on the LSRL?  Some calculation and discussion may help students discovery this fact about the slope of an LSRL:

rformula

This is not a fact students need to memorize in AP Stats, but certainly the discussion builds understanding of regression beyond what our calculator provides.

NORMAL APPROXIMATION OF THE BINOMIAL DISTRIBUTION

binomialLists on Desmos have strong potential for investigating a distribution by using a formula repeatedly.  In this Desmos demonstration, students investigate the behavior of the binomial distribution, using sliders to define values for n and p in the distribution.  Activating the normal curve folder allows us to assess the “fit” of the binomial distribution against a normal curve.  I added the purple dots near the top to make it easier to investigate where the normal approximation is strong/weak in approximating its binomial cousin.

While Desmos has a while to go before it will replace graphing calculators in my AP Stats class, these activities will be part of my classroom this year.  Looking forward to creating and sharing more!

Categories
Statistics

8 Take-Aways From USCOTS

This weekend, I spend two days at USCOTS, the United States Conference on Teaching Statistics at Penn State University. The opportunity to connect with old friends, share ideas, and reflect my own practices was exciting. Here are just a sampling of my experiences, many of which could be their own blog post.  You can find many speaker presentations and more resources on the CauseWeb site. Hope you enjoy!

MOVING FROM SANITIZED DATA SETS – a Keynote by Shonda Kuiper of Grinnell College noted that while interest in the study of statistics is at an all-time high, are we really preparing students to apply statistical concepts in a realistic manner? Shonda challenged the group to move from canned textbook data sets and let large, real data sets drive coursework.  Her Stats2Labs website is a treasure chest of activities and data sets, from which she shared a rich set of NY Stops and Arrests, and Shonda shared her methods for using the set to faciltate discussions.  For my high school classes, I am most looking forward to using the Tangram Game applet, which collects many variables on gameplay.
kuiper

I often tell my students that statistics is often about telling a story, and was thrilled to hear a college professor share this theme as well!

Photo May 30, 9 40 44 AMSTUDENT POSTERS – the poster sessions were interesting to me as a high school teacher, as my own students are preparing for “Stats Fair” next week.  How awesome to show my students that the presentations they are about to share are not too dissimilar from those they may encounter later in their academic careers, just in the sophistication of the studies and methods. You can’t beat having a small-group discussion with Beth Chance regarding the Rossman-Chance stats applets, which should be a part of every Stats class.  Posters on HS integrated math programs, flipped learning, and formative assessments provided info to think about for next year.

EGG ROULETTE – a session by James Bush and Jen Bready led to a fun “hook” I hope to try with my 9th graders next year.  James and Jen are masters of using video and pictures from the media to engage learners and grow discussion. Here, James chose Doug Tyson and I as “volunteers” to participate in a game. I quickly became worried when it was advertised as “Egg Russian Roulette”, and a clip from the Jimmy Fallon show was played:

me eggsWhat have I gotten myself into here?

The plot thickens when an egg carton makes an appearance…but filled with plastic eggs, some containing packing peanuts. I lost after 3 picks, and a simulation of the activity ensued from the group. Is there an advantage to being first? James alleges the person playing first loses 5/9 of the time. Try a simulation with your classes and find out!

CATCHING UP WITH OLD FRIENDS – Ruth Carver teaches high school about 20 minutes from me, and I cherish the times we find to trade stories.  By the time arrived at the conference, Ruth was already gushing over the many great sessions she had attended, and shared a quote from Dick DeVeaux which applies nicely to all classrooms:

Students like uncomfortable learning less and less.  They like things clear as a bell with no sweat, no thinking, no neurons firing.  They are confusing easy and comfortable with learning. To use a sports analogy, “Is that what you want from your sports practices – easy, comfortable, they didn’t break a sweat?  Well it should be the same with your classes; they should be sweating afterwards.  It’s hard stuff; they should be thinking hard.

What are we all doing to make sure our students sweat in math class?

Photo May 29, 6 04 25 PMIn return, I shared one of my new favorite ways to collect fun data: the website how-old.net. How well does it predict your age? What if you smile? What it I wear a hat? You will be toying with this and your friends at your next gathering.

SIMULATION-BASED INFERENCE –  This has become a hot topic in the stats world – I have come to use the StatKey site more often in my classes to have students simulate distributions – and was eager to learn how to leverage simulations with traditional hypothesis testing methods. Robin Lock and Kari Lock Morgan  shared examples where simulations allowed us to compute simulation distributions, but then move those results into traditional distributions and test statistics. My AP classes have generally been “successful” in that my AP passing rate is quite good, so it becomes tricky to want to ditch old methods. But the experiences and communication gained from simulation methods are too rich to be ignored. Infusing my classroom with more simulation-based inference could dominate much of my planning for next year.

CONNECTING – Connection was the theme of the conference, and a part of all of the talks. I strengthed bonds with old friends (many of whom I will see in 2 weeks for the AP Stats reading), and appreciate the many new folks I met for the first time. Doug Tyson’s silly selfie challenge gave me the courage to say hello to many people I wouldn’t normally have approched.  And though Doug won the challenge with a late-Friday “get” of Jessica Utts, the new AP Stats Cheif Reader – which I came so close to photo-bombing, I’ll take my photos with Allan Rossman and Roxy Peck as a well-deserved second-place.

Photo May 29, 6 17 19 PMPhoto May 29, 6 48 08 PM

DISCONNECTING – The saturday lunch-time talk by Michael Posner of Villanova University inspired the group by sharing the many connections he has made with the Stats community over his career. Michael often shares at our local PASTA (Philly-Area Stats Teachers Association) meetings, and I appreciate his desire to connect with high school teachers.

While explaining the power of connections he has made, Michael also challenged the group to disconnect, and reflect upon their teaching.  In particular, are we using our Stats expertise to clearly measure the efficacy of our teaching methods?  And while sharing ideas at conferences can be energizing, how do we personalize what we have gathered to work for our classroom?  Such great themes to consider at the close of a conference.

AFFIRMATION AND REFLECTION – When I first started teaching AP Stats, I was cautioned that stats teachers are often the lonliest people in their departments. Walk into a high school math planning room, bring up methods for solving quadratic functions, and you may soon have a full group conversation.  But try to start a discussion of two-sample t-tests?  Crickets…. This conference was attended by about 450 passionate stats people, with only about 10% being high school folks. But the college crowd could not have been nicer or more accomodating in wanting to share their ideas.  The entire experience left me energized that I am headed in (mostly) the right direction in what I do to encourage stats study, and with plenty of resources and connections for improving my practice.  Looking forward to USCOTS 2017!