Categories
Algebra Class Openers

Class Opener – Day 45 – Adventures in Standard Form

After a first half of the semester filled with Probability and Statistics goodness, my freshman course now shifts to algebra topics, and a bridge between topics many have not seen for 2 years as many of these students took algebra 1 in 7th grade.  The next few days will be a blitz of past ideas: slope, linear functions, inequalities and absolute value.  Today, one of my favorite pictures from Dan Meyer‘s fun site, 101qs, is quite a conversation starter:

955-san-francisco-house

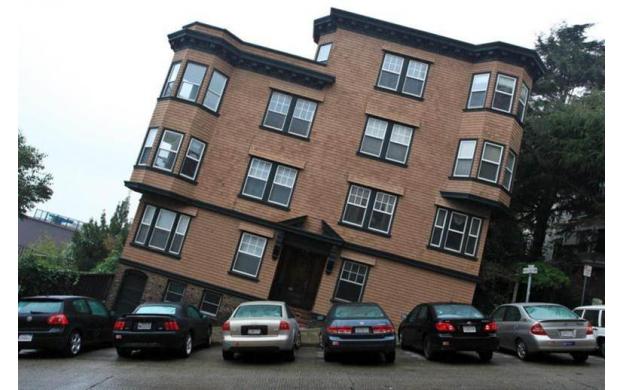
Why did they built it like that? How do they eat in that house?  How do they get in the front door?  What’s the bathtub like?  All are questions generated by the class.  You can enjoy more interesting questions generated by guests to the 101qs site. And we are off are running with slope!

I find that my students coming to the HS from our middle school have been trained well in navigating slope-intercept form for linear equations.  There are some stumbling blocks with fractions, and I need to do some hand slapping to keep kids away from their calculators, but I am mostly satisfied with where students are with slope-intercept form.

Standard form, meanwhile, is quite a different story.  Asking students to convert from slope-intercept form leads to painful moments: moving terms, and multiplying to rid ourselves of fractions.  But it also allows for entry to a new idea – leveraging relatioships with standard form and developing a new formula for slope, m = – A/B.  Developing this via some examples, and letting a few crackerjack students summarize this finding for the class, opens the door for a new method for finding the equation of a line.  Now, when presented with a slope and a point, we have two options.

OPTION 1: find the equation in slope-intercept form and convert to standard form. Messy, and some nasty fractions can appear!

2014-11-10_0002

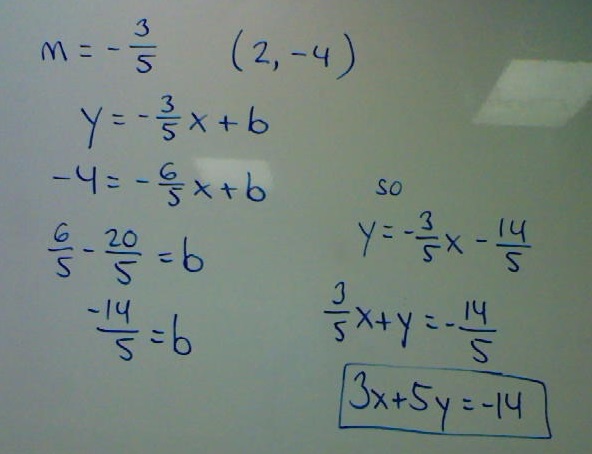
OPTION2: use what we have now discovered about slope and standard form to build our equation directly in standard form, and solving for C.

2014-11-10_0003

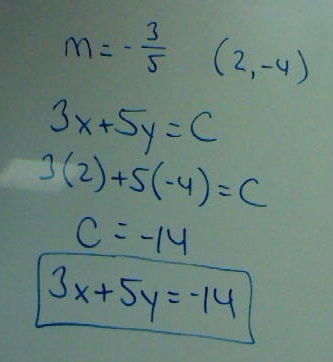
“Why didn’t they just show us this in middle school?!!!”  Well, maybe you weren’t quite ready then, or maybe standard form isn’t the star of the show it needs to be. In any case, today was a great day to combine old skills with some new explorations and keep things feeling “fresh”.  Tomorrow, the payoff will continue when we look at parallel and perpendicular lines, as homework tonight expands on today’s theme.

Categories
Class Openers Statistics

Class Opener – Day 44 – Statistics Clue Boxes

A problem I gave as review for our statistics test today became not only a source of conversation regarding vocabulary, but provided me some insight into the problem solving approaches of my students.

Here’s the problem. A list of numbers is given, listed in order, with some numbers removed:

pic2

The list has the following characteristics:

  • A mean of 76
  • A range of 32
  • An inter-quartile range of 21

Many students quickly understood the last blank must be 92, due to the range, but then became stuck.  As we’ve never explicity seen a problem like this before, the reactions from students was fascinating.  Some pockets of students had no fear in drawing circles and arrows to break down the data set. Others preferred to talk ideas out, but without putting pen to paper this doesn’t lead to solutions right away. I was thrilled to see a few students step up and take the lead, and explain their ideas to others, which then led to breakthroughs.  Identifying the positions of median and quartiles here lets us fill in one of the missing numbers:

pic1

But a subset of my class was content to watch from afar, waiting for hints which they assumed would come. Or worse, tuning out until I presented an explanation to the class….which never came.

And that last blank caused more trouble than I would have expected, as some students had trouble making the connection between the mean of a data set and the sum of its elements.  To help with this, I asked struggling students to provide me with any 4 numbers which had a mean of 10 (making them different numbers).  I asked students what I should be looking for to check accuracy besides computing the mean….and then, the light bulb!  All lists need to add up to 40!  So without explictly doing the empty blank problem in front of us, I sent students back to the board to think about this fact.  And the results were satisfying, as many of my fringe students could now complete the task and explain their procedure to their peers.

Students need to understand math ideas in many forms, and the concept of mean here demonstrates this need.  If you ask a student how to compute a mean, they most likely have little difficulty, and have had much practice:

Mean = sum of “scores” / count of “scores”

But in the missing numbers puzzle, the concept “felt” different and thus “new” to many students.  For me, this is where many students struggle in math classrooms.  Are we showing students how ideas and problems connect to big ideas?  Or does each combination of an existing problem become treated like a new experience?  It’s hard to break the pattern of students wanting specific rules for each type of math problem, when this is often the math conditioning they receive. But it’s worth the hard-fought battle.

And if you had fun with the challenge at the start of this post, try the similar problem I give later as an assessment:

boxes

Categories
Class Openers Statistics

Class Opener – Day 43 – Statistics as Art

Big Stats test tomorrow – students are getting antsy, lots of movement happening with review and reflection.  Today was a good day to step back, think about the role of numbers in society and appreciate some intriguing artwork.

Chris Jordan is a photographic artist whose works “Running the Numbers – an American Self-Portrait” cause you think of the largeness of our world, and the amount of waste we create. His website contains a number of fascinating pieces which zoom to reveal a statistic about our society’s wastefullness.  It’s an awesome experience, and we started class today by discussing a number of the pieces and the large numbers they represent.  There were a number of “whoa” moments as the composition of each picture was revealed, and I read the helpful statistic attached to each work.  Based on the size of each piece, there are some great estimation discussions to be had here as well.  It’s statistics – it’s art – world are colliding in a cool way!

Chris’s TED Talk “Turning Powerful Statistics Into Art” can also be shared with classes to learn more about the message of these pieces.