Engaging students in discussion of mathematics in applied situations is a rewarding experience. Seeing students immerse themselves in a task and offering to share their results makes a math class hum with excitement. But finding the right scenario, the right “hook” which will drive discussion can be an effort. While we hope to link math to real-life science and engineering, sometimes the silliest data collection experiments create a buzz in class.
I give you the Bubble Wrap Challenge.
The past week, I worked with a 7th grade teacher on a slope activity. By the end of the unit, students would be expected to compute the slope of a line via a formula. In my experience, students tend to understand indivdual aspects of slope,as they are often taught in pieces, but have difficulty shifting between meanings. What do we want students to understand about slope?
Slope between data points can be computed using a formula
Slope can indicate steepness
Slope can indicate a rate of change
As students entered the class, and the teacher took attendance, I was playing on a SMART Board with a Virtual Bubble Wrap Applet. You’ll need Java for it. I challenge you to play with it for less than 10 minutes, and without calling 3 friends over to play. Can’t be done. Try Manic Mode for the extra-special dose of stress relief.

After some initial playing, we sought to find the Inter-Galactic Bubble Wrap Champion of period 2. Each group was given an Ipad loaded with a similar app and 60 seconds to play the game. While a student played, a partner wrote down the player’s score every 10 seconds. Results were then plotted and a connected line-graph made.

Discussion then centered around finding not only the overall bubble-popping rate, but debating the 10-seconds intervals when Aiden was the most, and least successful, at bubble-popping. A second contestant was then added to the mix…
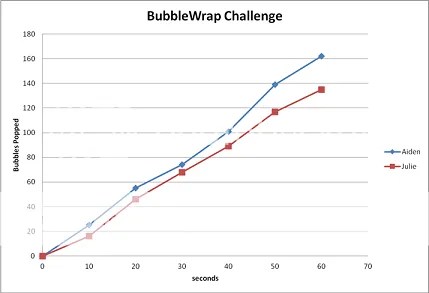
Which player was the fastest popper? Who was the best in a short period? Students were soon able to compute rates for segments, without prior knowledge of the slope formula. The teacher later introduced the formal formula. The payoff comes when students volunteer that we can identify the “best” popping rates by looking for steep segments, and lower popping rates in shallow segments.
Now back to popping some bubbles…..


