 The most recent challenge by the MTBOS (Math-Twitter-Blog-oSphere) is to share what’s on your classroom walls. (Follow the action on twitter, #MTBoS30)
This post will go beyond my own classroom, and take you on a tour of many classrooms of my colleagues. Here I present to you the Official Guide to Math Classroom Decoration.
To rank these items, I will be using the “Justin Scale”, an internationally-accepted scale of math beauty. It is based on the works of Justin Aion, who is an expert on classroom decoration. Seriously, you should be following Justin’s Blog for his daily classroom obsessions.
Here’s how the “Justin Scale” works
- 1 Justin = an insult to scotch tape
- 2 Justins = better than having a blank wall; marginally stimulating mathematically
- 3 Justins = setting the tone for an engaging math experience
- 4 Justins = cool beans!
You can see it’s pretty scientific. Now, on to the decor!
PROCEDURE POSTERS
 In the history of math posters, has any student ever looked at one of these and thought “hey, so THAT’S how you add fractions”…seriously? Sure, these posters are well-intentioned, but they are boring as heck and suck any imagination out of math class. Also, I have to cover them up anytime the SAT comes around.
VERDICT:

MATH T-SHIRTS

I like to have items around my room which tell a story. Maybe they are stories of past students or experiences; other times they remind me of math nuggets I pull out once a semester. These shirts are from a number of Muhlenberg College Math Contests from the past few years, each with a neat math concept from the year of the contest. On the left, the 28th year celebrated 28, a perfect number. 27 is a cubic formula, and the 31st features the Towers of Hanoi. Full disclosure, I designed the 16th shirt as an undergrad.
VERDICT:

TI CALCULATOR POSTER
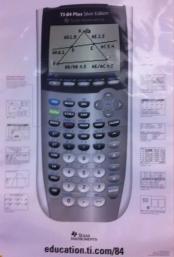
 Go to any math conference and you’ll find gaggles of math teachers walking around the vendor area with swag bags, free stuff the many companies have for you. TI posters are one of the most popular items, and you’ll find many math classrooms sporting these artifacts of math boredom. “It was free, therefore I must place it on my wall”
These posters fill lots of space and give your room the right dose of geekiness. And a reminder of the vast machine TI is. Have any english teachers ever placed a large photo of a typewriter on their wall? Nope.
VERDICT:

INFOGRAPHICS

 So many cool infographics to choose from, so little toner. Love posting these guys all over my room; love it even more when I find kids checking them out just before the bell. But they are a pain to print, and they age badly.
VERDICT:

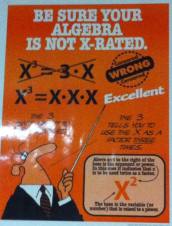
ASSORTED MATH HUMOR / INSPIRATIONAL POSTERS

Usually purchased by rookie teachers, you will find these posters at your local teacher supply store. Hunting season for these posters is short, running from early August to mid-September, so get yours while they last. “Is that a cat hanging from a tree”….why yes, yes it is….
VERDICT:

PICTURES OF INTERESTING THINGS
You don’t need to try hard to find neat stuff for your classroom. A colleague of mine, who often teaches geometry, has pictures of neat things above his board. Here’s your challenge: find your favorite items from 101qs.com, print them, and post them all over the place. The conversations start themselves.
VERDICT:

STUFF KIDS MADE AND DID

Anytime you can post, share and provide inspiration through student work, it’s bonus time. Here, I share pictures from many past years of our AP Statistics Fair. These often lead to stories of projects past, and where many of these students are now in their colleges and careers. As we get later in the year, student work will take over many of the empty spaces on the walls. Also, I have a John McClane action figure on this board….and you can’t blaspeheme Nakatomi Plaza….never forget!
VERDICT:

 The most recent challenge by the MTBOS (Math-Twitter-Blog-oSphere) is to share what’s on your classroom walls. (Follow the action on twitter, #MTBoS30)
 In the history of math posters, has any student ever looked at one of these and thought “hey, so THAT’S how you add fractions”…seriously? Sure, these posters are well-intentioned, but they are boring as heck and suck any imagination out of math class. Also, I have to cover them up anytime the SAT comes around.


 Go to any math conference and you’ll find gaggles of math teachers walking around the vendor area with swag bags, free stuff the many companies have for you. TI posters are one of the most popular items, and you’ll find many math classrooms sporting these artifacts of math boredom. “It was free, therefore I must place it on my wall”

 So many cool infographics to choose from, so little toner. Love posting these guys all over my room; love it even more when I find kids checking them out just before the bell. But they are a pain to print, and they age badly.


