Categories
Algebra Technology

You Asked For Piecewise Functions, I Give You Piecewise Functions!

NEW: After popular demand from this post, I have created a tutorial on domain restrictions and piecewise functions.  Enjoy!


UPDATE: Many of my Desmos files are avilable on this page: Desmos File Cabinet Enjoy!

Let is never be said that mathcoachblog doesn’t listen to the needs of its followers!  One of the neat things about having a blog is checking out the routes people take to get to the blog. What search caused them to arrive here?  What countries are my visitors from?  What search phrases cause them to reach the blog?

Every day, without fail, there is a theme which appears in the search terms of blog visitors.  Here is a sampling of terms from just the last week:

  • Online piecewise graphing calculator
  • Graph a piecewise function online calculator
  • Piecewise function calculator online
  • Graphing piecewise functions calculator online
  • Piecewise functions online grapher
  • Online graphing calculator piecewise functions
  • How to do a piecewise function on Desmos

OK, folks I get it.  We want to graph piecewise functions.  So, let’s light this candle.

GRAPHING PIECEWISE FUNCTIONS ON DESMOS

The Desmos knowledge base provides instructions for graphing a piecewise function, and a neat video tutorial.  But I’ll provide a few examples here, and some teaching tips.  Let’s say we want to graph this piecewise function:

In the Desmos calculator, colons are used to separate domain restrictions from their functions.  And commas are used to have multiple function rules in one command.  So, the piecewise function above would be entered as:

Piecewise Entry

The function then appears quite nicely:

Function1

Sliders can be used to have students explore the continuity of a piecewise function.  Consider this problem:

For what value(s) of x is the piecewise function below continuous?

In Desmos, start by defining a slider for the parameter “a”.  For mine, I chose to limit the domain to between -10 and 10, and have step counts of .5.  Then, a can be used in the piecewise function.  Click the icon below to play with the document online.  The sharing features are another aspect of Desmos which have improved greatly in the past year.

SO, WHY ARE YOU AVOIDING “EQUALS” IN YOUR FUNCTIONS?

OK, smart guy, yes…yes, I have kinda avoided the equals parts of the domain restrictions.  Something neat (odd, goofy) happens when an equals is used in the domain restrictions.  Let’s graph this function:

Click this link to find out what happened when I tried to enter this function on Desmos.  The Desmos folks tend to monitor these things, so let’s see if they have a suggestion here.

Down the road, I want to take a deeper look at the new table feature, and will report out.  But my early impression is that it is a addition which works seamlessly with the existing, awesome, calculator.

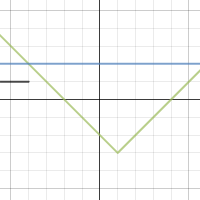
Also, while I’m in a sharing mood, here is a quick file I created to use in an absolute value inequality unit.  Click below to check it out.  Would enjoy your input!

And finally, I started this post by sharing some of the search terms which cause people to find my blog.  Most of the time, I can explain those terms, and why people would end up here.  But this….well….this, I got nothing…..

search terms

Categories
Statistics Technology

A Bowl of PASTA with Stats Friends

Today I attended the winter meeting for one of my favorite organizations: PASTA, the Philadelphia Area Statistics Teachers Association.  This group meets a few times a year to discuss best practices in statistics education, and includes a number of AP teachers, many of whom are AP exam readers.  As always, lots of interesting ideas today:

Joel Evans, from my home school, spoke on his first attempts to “flip” his AP Statistics class.  Based on feedback from his students, Joel realized that Powerpoints often dominate his classroom culture.  By flipping, Joel hoped to have students review material before class, then use class time to practice and discuss.   Follow Joel’s flipping story in the slides below.

It is always a pleasure to have Daren Starnes at our meetings.  Daren, one of the co-authors of the ubiquitous The Practice of Statistics textbooks, joins our group often to discuss his ideas for teaching statistics.  Today, Daren shared a presentation, “50 Shades of Independence”.

Daren asked us to think about all of the places where we encounter “independence” in AP Statistics:

  • probability of independent events
  • independent trials
  • independent random variables
  • independent observations
  • independent samples
  • independent categorical variables (chi-squared)

Man, that’s a lot of independence!

Which items from the list above deal with summarizing data?  Which are needed for inference?  How are they related?  How do we help our students understand the varied, and often misunderstood, meanings of independence.

Daren has a knack for leading conversations which invite participants to express and discuss their math beliefs. Daren   Many of the arguments concerning independence, according to Daren, are “overblown”, in that teaching them in a cursory manner often causes us to lose focus on the big picture. That’s not to say that we should discard them, but that, when teaching inference, we should have students focus on items which would cause a hypothesis test to be “dead wrong” if we didn’t mention them, i.e. randomness, justifying normality conditions.

penniesRuth Carver continued the presentations with some new tech twists on a lesson used by many stats teachers: analyzing sampling distributions by looking at the age of pennies.  A population graph of the ages of 1000 pennies hangs proudly in Ruth’s classroom.

After agreeing that the population is clearly skewed right, we move to the main event – drawing random samples from the population and analyzing the data we get from repeated samples of the same size.  Ruth has developed a lesson for the TI Nspire which generates the samples, and challenges students to think about the behavior of the sampling distributions, now considering the effects of sample size.  Ruth’s presentation allows students to experience and express the differences between:

  • Standard deviation of a population
  • Sample standard deviation
  • Standard deviation of a sampling distribution

Ruth

Great job Ruth!  Looking forward to more PASTA with my stats friends!

Categories
Uncategorized

Worksheets and Differentiation – Not Always Mutually Exclusive!

I hate worksheets.

Is there anything worse than a math classroom where the pace and expectation are dictated by the almighty worksheet?  OK class, continue working on the blue worksheet, and homework will be on the pink worksheet.  Tomorrow, we will do test review with the aqua worksheet.  And then we will have a whole new chapter packet to work on….blah….

Don’t get me wrong…I’m not anti-practice.  Much of math is like learning to play the piano, you need to expend some sweat in order to master skills.  But, like playing the piano, all students will master the skills differently, with different timelines.  And, like piano players, some students will handle rigor and improvisation quicker than their peers.

So, how do we provide students with appropriate practice, while at the same time allowing students to have some say in their learning, assess their own progress, and provide for differentiation? Here are two strategies for you to try:

POINT-VALUE ASSIGNMENTS

In this strategy, students are not required to complete all assigned problems (unless they choose to). Instead, problems are assigned individual point values, and students complete enough problems to earn the assigned number of points. Easier problems have smaller point values, while more challenging ones are worth more.

Here’s an example, which use the Linear Functions Review given here (pdf): Linear Functions Review

This review has 18 problems, increasing in difficulty.  One way to assign point values would be:

  • Problems 1-7, 1 point each: these problems can be done mostly by looking at the linear pattern and providing a quick answer.
  • Problems 8-14, 2 points each: these problems mostly ask students to match function rule to situations.
  • Problems 15-18, 3 points each:  open-ended, and all require students to develop a function rule.

For this assignment, I would ask students to complete 12 points worth of problems.  This would require students to reflect upon their understanding, and provide differentiation.  How could students complete the assignment?

  • Students at a basic level could complete all 1-point problems, but would then also need to complete at least 3 of the 2-point problems (of their choice).
  • Students comfortable with the material could complete a mix of 1, 2 and perhaps 3-point problems.
  • Students at the advanced level could complete only all 4 of the 3-point problems.

The worksheet provided here was created uses the fantastic site Problem Attic, developed by EducAide software.  The site has a large bank of problems from various state, national and international assessments, and allows users to create their own customized assessments.  Definitely worth checking out!

CHOOSE-YOUR-OWN PATH

Many textbooks (particularly high-school texts) will arrange their problems sets into A, B and C levels.  Do I need to see students complete all problems from a set?  If a student demonstrates mastery of a C-level problem, do I really need to see them complete many A and B level problems?  This strategy allows students to choose the best path for completing an assignment, using this template:

Choose a Path

In this assignment, all students start with a B problem, then choose their own path for completing the assignment, by selecting one of 3 colored paths.   This could mean completing a few A problems, with a few B problems.  Other students many choose the series of B problems, with a few A’s sprinkled in.  Ambitious students may choose the challenging C problem to complete.

With both strategies, students are challenged to reflect upon their own learning, make appropriate choices, and take responsibility for their progress.  Classroom expectations don’t change at the drop of a hat, and may take a few conversations and failed attempts before working the way you like.  But they payoff, increasing student responsibility and reflection, are worth the pain.