Categories
Middle School Statistics

The Common Core and Simulation Models

The Common Core Standards provide an exciting opportunity for statistics education, with inference concepts starting informally in middle school and sampling distributions with inference moving into the high school mainstream. Under the “Probability and Statistics” strand, we find the following:

Make inferences and justify conclusions from sample surveys, experiments, and observational studies

CCSS.MATH.CONTENT.HSS.IC.B.4
Use data from a sample survey to estimate a population mean or proportion; develop a margin of error through the use of simulation models for random sampling.

But many of our high school teacher colleagues will need supports to help their students think statistically.  AP Stats teachers, often the loneliest folks in their departments, will now need to share their expertise with non-stats inclined colleagues.  Below are snapshots from a lesson on sampling and margin of error I used with my 9th grade classes, with many ideas adapted from my AP Stats teaching experiences.

STARTING WITH SAMPLING DISTRIBUTIONS

Student in this class had already been exposed to a probability unit, which included conditional probabilities, binomial settings and the normal distribution.  After a discussion of sampling techniques, I wanted to conceptualize margin of error before diving into formulas.  Here’s what I did:

  • Class is broken in two large groups
  • Each side of the room was given the task of flippling virtual coins, using a graphing calculator
  • For one side of the room, 25 coins were flipped.  For the other side, 100 coins were flipped.
  • “Coins” were sorted and counted, and the proportion of heads communicated to team captain, who recorded the result on a group graph.

The results for the two groups are shown here.Coins

The class discussion the moves to a comparison of the graphs.  How are they similar?  How are they different?  Clearly, both graphs center about the true proportion (.5).  The shapes also seem similar.  But the vaiability seems to be different.  How likely is it to have 60% of coins show heads, if 25 coins are flipped?  Does this likelihood change with 100 coins?  We’re moving towards sampling distributions and inference topics, without all the scary-sounding language.

LINKING SAMPLING TO PUBLIC-OPINION POLLS

In the next part of the lesson, I wanted students to explore public-opinion polls, choose a topic of interest to them, and think about the associated language and structure. The site pollingreport.com is ideal for this.  The site collects and summarizes poll results from many sources, categorized by topic.

Polling Report

Student pairs were asked to find one poll of interest to them, record the source and the number of people surveyed, and record it on the back board.  We then looked for common threads:

  • Sources: we found many repeats in the sources chosen (Rasmussen, Gallup, Washington Post, FoxNews) and discussed reliable sources of information.
  • Sample sizes: most surveys had about 1,000 participants, with one poll using 2,000.

Can 1,000 people possible allow us to represent a population?  How reliable can we expect a poll to be if just 1,000 people are surveyed?  Time to move on to the last stage of the lesson – simulation.

SAMPLING WITH STATKEY

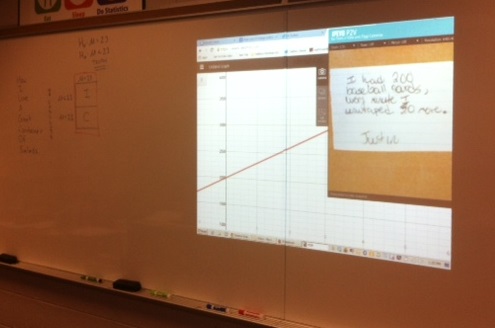
The great free site StatKey allows us to look at sampling distributions easily and discuss our observations.  In my class, pairs had a netbook for exploring the site.  We started with the poll about college football above, where 47% of those surveyed registered “support”.  If 47% is the true proportion, and we survey 1000 people, how close to 47% should we expect to see in our survey?  Is 46% plausible?  How about 44%, or even as low as 40%?  We can set the population parameter, and the sample size, then it’s time to draw some samples:

StatKey1

Most of the possible samples center about 47%, but here’s the follow-up for class:

A large majority of the possible samples seem to be within ___ % of 47%.

Certainly, we see that ALL of the surveys are within 10%, but can we narrow that window?  After some dicsussion, the class agreed that 3% was a reasonable window for capturing a large portion of the surveys.  How many of the samples here are within 3% of the “true” proportion of 47%?  StatKey can take of that work for us:

StatKey2

As the unit progressed, StatKey was always shining up on the board to verify our margin of error calculations, and provide a link to the sampling distribution ideas.


Categories
Algebra

When Subtraction Problems Aren’t Really About Subtraction

There’s a subtraction problem making it’s way around the internet, supposedly authored by a electronics engineer / frustrated parent (but who knows whom the real author is…) which rails against the “Common Core Mathematics approach” to subtraction:

Subtraction

Online debate with math folk I follow on Twitter has centered on this parent’s misunderstanding of Common Core; that while the standards describe skills students should master, they do not suggest methods for reaching the standards.  My friend Justin Aion has done a fantastic job of summarizing the disconnect on his blog.  Feel free to leave here for a few moments are check out this wonderful summary.  Meanwhile, Christoper Danielson has provided an annotated version, which lends some clarity to the intent of the given question.  His blog provides additional clarifying examples.  It’s another great read!

Annotated

To this engineer / parent, I would ask why, if time efficiency is your primary motivation, then why bother even writing down the problem?  If it takes you 5 seconds with your traditional method, and I can perform the calculation in 2 seconds with a calculator, then you should be fired and replaced as I can do the problem with a 60% efficiency increase.  But I suspect this parent doesn’t want to entertain this argument.

THE HIGH SCHOOL PERSPECTIVE

I’m a high school math teacher, so why should I care about the method students use to subtract numbers?  Once students learn how to subtract, they take a test to prove their learning, and we move on to the next idea.  It’s just that easy…..or is it?  Actually, this debate matters quite a bit to us high school folks, as it speaks to the global issue here: What does it mean to teach and learn mathematics?  Which of these choices best describes what you want from your math students:

  • I want students to master a series of skills, and apply them when needed.
  • I want students to understand structures, and apply these understandings to increasingly complex structures.

I suspect that most non-educators, and perhaps many of my math teacher colleagues, feel that the first choice is just fine.  And this is the problem.  Math in our schools is often presented as a series of disconnected skills.  Once you master addition, you get to do subtraction, then you can do multiplication, then eventually fractions and decimals.  4th grade math is a step up from 5th grade math, then 6th grade. Eventually, after we run out of those skills, you get to take algebra, which is a distinct experience from all previous maths.

It turns out that the skills students learn in elementary school, and their embedded understandings, have deep consequences when it’s time to consider algebra.  Students who have been exposed to methods which promote generalization, reflection on algorithms, and communication will find a transition to formal algebra a seamless experience.  Here’s an example:

ADDING RATIONAL EXPRESSIONS

Depending on your school’s or state’s algebra structure, a unit on rational expressions, and operations on them, often comes around the end of Algebra 1 or the start of Algebra 2.  A problem from this unit might look like this:

An activity I use at the start of this unit often allows me to identify students who understand structures, compared to those who have memorized a disconnected process.  Index cards are handed out, and students are asked to respond to the following prompt:

What does it mean to find a Least Common Denominator (LCD)?

I have given this prompt for many years, with students in all academic levels.  Without fail, the responses will fit into 3 categories:

  • Students who use an example to demonstrate their mastery of finding LCD’s (such as: if the denominators are 6 and 8, the LCD is 24) without justifying which their approach works.
  • Students who attempt to describe a method for finding a LCD, often using approproate terms like factors and products, but falling short of a complete definition.
  • Students who don’t recall much about LCD’s at all.

Students are first exposed to least-common denominators at the start of middle school, perhaps earlier, when it is time to add fractions.  I suspect that many teachers support a similar approach here: make lists of multiples of each denominator, and search for the first common multiple.

LCDs

It’s an effective method.  And many of my students, even my honors kids, have been “good at math” by mimicking these methods. But how many students can remove these training wheels, and can describe a method for finding an LCD given ANY denominator. Lists are nice, but they aren’t always practical, and they certainly don’t provide an iron-clad definition.  A procedure which ties together understanding of prime factors and their role becomes useful not only in middle-school, but carries over to our study of rational expressions:

A least-common denominator is the product of the prime factors in each denominator, raised to the highest power with which the factor appears in ANY denominator.

I don’t suggest that teachers provide this definition on day 1, and have students struggle with its scary-looking language.  Rather, generalizations require development, discussion and reflection.  Certainly start with making lists, but eventually teachers and students need to analyze their work, and consider the underlying patterns.

Here’s your homework: provide your elementary-age student a subtraction problem.  Then ask them to defend why their method works.  It’s the understanding of structure which seprates “skills in isolation” math versus “big picture” math.  We need more big picture thinking.

Categories
Algebra

Linear Function Stories

My 9th graders has been working through a unit on linear functions.  This co-taught class contains students who went through a traditional Algebra 1 class in semester 1, and are now in a course with me as preparation for the Pennsylvania Keystone Alegbra 1 Exam in May.  While developing core algebra skills is a goal for this course, the literacy skills are also a challenge.  The Keystone exam is language-heavy, and these students need as many opportunities as possible to read and communicate.

WHAT I DIDN’T WANT TO DO:

  • Provide endless worksheets and textbook problems with no context
  • Introduce technology tools after “traditional” mastery

WHAT I SET OUT TO DO:

  • Provide multiple means to evaluate linear function scenarios
  • Use technology from day 1 to evaluate data
  • Allow an opportunity to peer-assess student works

 Graphing StoriesWanting to stress contexts from day 1, I used the site Graphing Stories by Dan Meyer and BuzzMath, as an opener a few times within the first 2 weeks of class.  The site provides 15-seconds video of a scenario (such as time vs height on a rope swing), and students use pre-made graph paper to develop a graph which matches the scenario.  As an opener, I appreciate this site as a place to start conversations.  A document camera is used to display student works, which are randomly chosen from my handy popsicle stick collection.

In algebra class, students often learn slope as rise / run, and my students were able to recall this “definition”.  Almost all students were able to recall the slope formula, given two points, and could compute a correct slope (with some minor math errors).  But considering slope as a rate of change within a context was a mostly new experience.

For each of the last few days (after we had seen many of the Graphing Stories), I have given a similar opener.  A graph is given, and students must give the equation, AND a sentence which provides a possible scenario for the graph.  Sort of an inverse-Graphing Story.  Here was today’s opener:

graphstory_zpse3409f6a

After a few minutes, I collected the student responses, which were written on index cards.  In our review phase, I shuffled the cards, and chose random samples of student works to share under the document camera. The projector showed the original graph, along with the story:


“I had 200 baseball cards, every minute I unwrapped 30 more”

photo_zps020e1936.JPG

To check the student’s story, we looked at two criteria:

  • Does the story have a correct starting point?
  • Does the story have a correct rate of change?

Results are still mixed, ranging from responses which are on-point or emerging:

  • “Tommy saw 200 bugs, every second 30 more bugs showed up” (I have a lot of critters in my room)
  • “I start with $200 and I get $30 each week”
  • “There are 200 people with car insurance every hour 20 people get car insurance when they see the Geico commercial”

To those who still need more practice:

  • “Every 70 days 200 pizzas come to the pizza shop”
  • “There were 30 spiders and every minute 200 more spiders come”
  • “There are 30 toddlers each earn 200 pennies”

But the responses get better every day, and we celebrate the successes of those who improve, and learn to critique work appropriately!