The Chi-Squared chapter in AP Statistics provides a welcome diversion from the means and proportions tests which dominate hypothesis test conversations. After a few tweets last week about a clay die activity I use, there were many requests for this post – and I don’t like to disappoint my stats friends! I first heard of this activity from Beth Benzing, who is part of our local PASTA (Philly Area Stats Teachers) group, and who shares her many professional development sessions on her school website. I’ve added a few wrinkles, but the concept is all Beth’s.
ACTIVITY SUMMARY: students make their own clay dice, then roll their dice to assess the “fairness” of the die. The chi-squared statistic is introduced and used to assess fairness.
 You’ll need to go out to your local arts and crafts store and buy a tub of air-dry clay. The day before this activity, my students took their two-sample hypothesis tests. As they completed the test, I gave each a hunk of clay and instructions to make a die – reminding them that opposite sides of a die sum to 7. Completed dice are placed on index cards with the students names and left to dry. Overnight is sufficient drying time for nice, solid dice, and the die farm was shared in a tweet, which led to some stats jealousy:
The next day, students were handed this Clay Dice worksheet to record data in our die rolling experiment.
In part 1, students rolled their die 60 times (ideal for computing expected counts), recorded their rolls and computed the chi-squared statistic by hand / formula. This was our first experience with this new statistic, and it was easy to see how larger deviations from the expected cause this statistic to grow, and also the property that chi-squared must always be postivie (or, in rare instances, zero).
Students then contributed their chi-squared statistic to a class graph. I keep bingo daubers around my classroom to make these quick graphs. After all students shared their point, I asked students to think about how much evidence would cause one to think a die was NOT fair – just how big does that chi-squared number need to be? I was thrilled that students volunteered numbers like 11,12,13….they have generated a “feel” for significance. With 5 degrees of freedom, the critical value is 11.07, which I did not share on the graph here until afterwards.

In part 2, I wanted students to experience the same statistic through a truly “random” die. Using the RandInt feature on our calculators, students generated 60 random rolls, computed the chi-squared statistic, and shared their findings on a new dotplot. The results were striking:
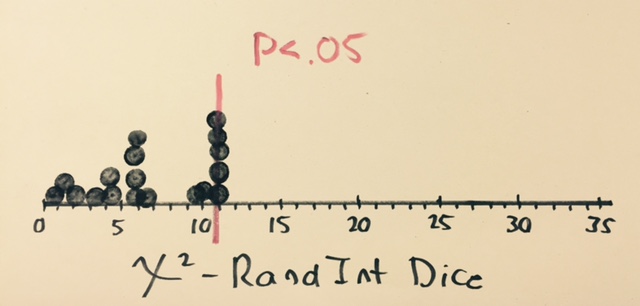
In stats, variability is everywhere, and activities don’t often provide the results we hope will occur. This is one of those rare occasions where things fell nicely into place. None of the RandInt dice exceeded the critical value, and we had a number of clay dice which clearly need to go back to the die factory.

10 replies on “Statistics Arts and Crafts”
Love it. Especially asking students what outcome would be convincing to think a die was not fair. Excellent.
thanks so much for sharing your activity. although I don’t have time for my kids to make clay die this year, I will be using irregularly shaped die with the same idea. your activity (and Beth’s) were the inspiration. what a creative idea to use bingo daubers for making dot plots. loving it!
[…] post about “clay dice are drying.” I wanted to know more, so Bob posted a blog entry Statistics Arts and Crafts about his Chi-Square GOF activity. We are starting GOF today in AP Stats, so no time to have my […]
Found these today. perhaps you know already.
from John McGowan
http://math-blog.com/2015/05/04/review-of-statistics-done-wrong-the-woefully-complete-guide/
http://www.statisticsdonewrong.com/
Very cool and fun. I’m trying to transition to a more exploratory and project based approach. Lecturing is killing both teacher and student. This might even be a great opening activity to introduce exploratory data analysis and then save the materials and data for sections on probability, expected value and hypothesis testing. Very cool!!
[…] Statistics Arts and Crafts, Bob Lochel […]
[…] what I thought was a cool activity last year at Bob Lochel’s Blog about having students make their own die as an introduction to the χ² Goodness of Fit. Unfortunately I found it the week after we had […]
Thanks for this excellent activity idea! I tried it in my college Intro Stats course today.
I thought I’d save some time by using only n=30 rolls per die (going along with the rule of thumb that a chi square distribution is appropriate when the expected count is at least 5 in each cell). Unfortunately, it seems we didn’t have enough power! Only a couple of handmade dice (out of 50ish) had chi-squared values above the critical value of 11.07.
A quick simulation in R suggests that n=60 gives 80% power for detecting a moderately unfair die where one face has probability 2/7 and the other five faces have 1/7 each. Meanwhile, my n=30 rolls gave only 20% power:
mean(replicate(100000, sum((rmultinom(1, 60, c(2/7, rep(1/7, 5)))-rep(60/6, 6))^2))/5 > 11.07)
## [1] 0.79563
mean(replicate(100000, sum((rmultinom(1, 30, c(2/7, rep(1/7, 5)))-rep(30/6, 6))^2))/5 > 11.07)
## [1] 0.22058
So, next time, I’ll try your n=60 rolls per die instead!
Whoops, there’s a mistake in my power calculations… It turns out to require more like 140 rolls to get 80% power here. But 60 rolls still gives 40% power, better than the 20% power from 30 rolls.
mean(replicate(100000, sum((rmultinom(1, 30, c(2/7, rep(1/7, 5)))-rep(30/6, 6))^2))/(30/6) > 11.07)
## [1] 0.22135
mean(replicate(100000, sum((rmultinom(1, 60, c(2/7, rep(1/7, 5)))-rep(60/6, 6))^2))/(60/6) > 11.07)
## [1] 0.41277
mean(replicate(100000, sum((rmultinom(1, 140, c(2/7, rep(1/7, 5)))-rep(140/6, 6))^2))/(140/6) > 11.07)
## [1] 0.79509
What a fantastic entry point to power! I really chose 60 originally because it made the “expected” easy to talk about. I think that discussing when we don’t do 30 will become part of my talk here.