Categories
Algebra

Linear Function Stories

My 9th graders has been working through a unit on linear functions.  This co-taught class contains students who went through a traditional Algebra 1 class in semester 1, and are now in a course with me as preparation for the Pennsylvania Keystone Alegbra 1 Exam in May.  While developing core algebra skills is a goal for this course, the literacy skills are also a challenge.  The Keystone exam is language-heavy, and these students need as many opportunities as possible to read and communicate.

WHAT I DIDN’T WANT TO DO:

  • Provide endless worksheets and textbook problems with no context
  • Introduce technology tools after “traditional” mastery

WHAT I SET OUT TO DO:

  • Provide multiple means to evaluate linear function scenarios
  • Use technology from day 1 to evaluate data
  • Allow an opportunity to peer-assess student works

 Graphing StoriesWanting to stress contexts from day 1, I used the site Graphing Stories by Dan Meyer and BuzzMath, as an opener a few times within the first 2 weeks of class.  The site provides 15-seconds video of a scenario (such as time vs height on a rope swing), and students use pre-made graph paper to develop a graph which matches the scenario.  As an opener, I appreciate this site as a place to start conversations.  A document camera is used to display student works, which are randomly chosen from my handy popsicle stick collection.

In algebra class, students often learn slope as rise / run, and my students were able to recall this “definition”.  Almost all students were able to recall the slope formula, given two points, and could compute a correct slope (with some minor math errors).  But considering slope as a rate of change within a context was a mostly new experience.

For each of the last few days (after we had seen many of the Graphing Stories), I have given a similar opener.  A graph is given, and students must give the equation, AND a sentence which provides a possible scenario for the graph.  Sort of an inverse-Graphing Story.  Here was today’s opener:

graphstory_zpse3409f6a

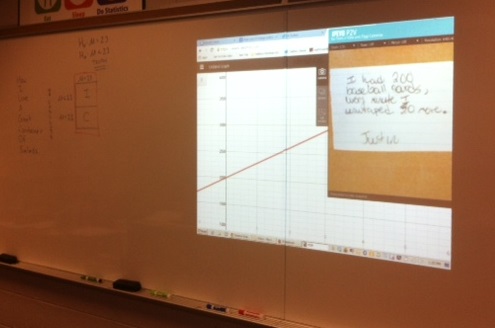
After a few minutes, I collected the student responses, which were written on index cards.  In our review phase, I shuffled the cards, and chose random samples of student works to share under the document camera. The projector showed the original graph, along with the story:


“I had 200 baseball cards, every minute I unwrapped 30 more”

photo_zps020e1936.JPG

To check the student’s story, we looked at two criteria:

  • Does the story have a correct starting point?
  • Does the story have a correct rate of change?

Results are still mixed, ranging from responses which are on-point or emerging:

  • “Tommy saw 200 bugs, every second 30 more bugs showed up” (I have a lot of critters in my room)
  • “I start with $200 and I get $30 each week”
  • “There are 200 people with car insurance every hour 20 people get car insurance when they see the Geico commercial”

To those who still need more practice:

  • “Every 70 days 200 pizzas come to the pizza shop”
  • “There were 30 spiders and every minute 200 more spiders come”
  • “There are 30 toddlers each earn 200 pennies”

But the responses get better every day, and we celebrate the successes of those who improve, and learn to critique work appropriately!

Categories
Algebra

Top 5 Things I Love About Pascal’s Triangle

This week, my 9th grade Prob/Stat class has been working through the Binomial Theorem. With many rich patterns and connections to explore, the unit begins with the class jigsaw, where students examine seemingly disconnected math concepts, and discover unexpected relationships.  This year we have been using Wolfram|Alpha to validate our work, and discover more patterns.

Sharing the many patterns in Pascal’s Triangle is a real boost for me. This year, few students had seen the triangle before (which is a shame, as they are 9th graders!), so this was all new to them.  If math is the science of patterns, then this is the center of the universe…would love to build a fun elective around it.  Here are my 5 favorite Pascal’s Triangle ideas to share:

THE HOCKEY STICK THEOREM:

Start at any of the 1’s on the outside, slide your finger along the diagonal, going deeper into the triangle. Stop at any point, and instead of continuing along the diagonal, divert to the connected number in the next row. This number will be equal to the sum of the numbers along your traced path.

Here, 462 = 1 + 5 + 15 + 35 + 70 + 126 + 210

Pasc1

Can you verify this one?

Pasac2

And think about the proofs we can develop together. Move proofs from geometry and into combinatorics.

COOL DIAGONAL PATTERNS

Many students quickly identify what is happening along the diagonals:

  • Along the sides, there are 1’s
  • Along the next diagonal, we have consecutive numbers (the counting numbers)

But is that all?  Nope…more cool stuff!

  • The next diagonal reveals the TRIANGULAR NUMBERS: 1, 3, 6, 10, 15… (those numbers which make cute equilateral triangles if we make them with dots.
  • Next, we have the TETRAHEDRAL NUMBERS: 1, 4, 10, 20, 35… (making cool pyramids with marbles!)
  • And we can even locate the FIBONACCI NUMBERS, if we hunt enough!

COLORING PATTERNS

Take your triangle, and color in all the multiples of 2.  You’ll find some cool patterns emerge.  How about multiples of 3?

Pasc3

This fun applet colors up to 256 rows. Try some prime numbers for wild, unexpected results. The coloring party continues when you look at coloring remainders.

COIN FLIPPING FUN

All of the entries in any row tell us the number of possible combinations in a binomial experiment. While coin flipping is not all that sexy, I have used these facts to play Plinko with my classes, which I have used in STEM talks before. Today in class, students created their own graphs of flipping results, using randint on their graphing calculators.

And…Galton Boards!!! Which I told my students I would offer 1,000,000 bonus points if they built for me.

IT RELATES TO GEOMETRY AND CHAOS

A few days before this unit, I had an animated gif of Sierpinski’s Triangle projected on my board as students walked in. Many students identified it from their Geometry class, and most were enthralled by the seemingly infinite self-similarity.  So when a few days later I go rambling on about Pascal, dive into coloring patterns, and reveal the first 265 rows of colored even numbers……wait…what’s this?????
Pasc4

It’s our old friend Sierpinski out to play. And if you haven’t before, develop this cool visual by playing the Chaos Game on the rich Cut The Knot site.

Categories
Algebra Middle School

The Puzzle Solutions You’ve Been Waiting For….

This post will present solutions to two puzzles I have presented here on the blog, and some ideas for extending the learning with your students.

THE TAKE-AWAY GAME:

This is a game I proposed a while back on the blog, and it took my friend Anthony from Twitter’s gentle nudging to ask for a solution.  Here’s a re-cap of the game:

  • 23 marks are placed on a board
  • On each turn, a player must remove 1, 2 or 3 marks
  • The player who clears the board wins

I often challenge classes with this game, letting kids play me and try to figure out the secrets.  The beauty here is that my students are often polite souls, and will let me go first…which leads them to doom.  It will often take a few days before a student can conquer me.

Here’s a video example:

And here is the message I sent back to Anthony, who requested the secrets to the game.

Here’s the secret to the take-away game – if I can make it so that the number of dots remaining is a multiple of 4, then I will win the game – guaranteed.  If they take away 3, I remove 1.  When they remove 2, I remove 2.  If they remove 1, I remove 3.  The game is all about groups of 4.  

With 23 dots to start the game, I will offer the student a choice; who plays first.
If they let me play first (which they often do because they want to be polite), then I erase 3 dots (leaving 20) and wait for their eventual demise.  If they play first, then I need them to slip up and make it so that I can control the multiples of 4.  If they erase 2 on their first move, then I remove 1, leaving 20.  
 
It often takes a few days of playings at the end of class for kids to develop the strategy.  They will first realize that being left with 4 is sure doom.  Then 8….then eventually they get it.
Have fun
And here are some ways to tweak the game, and see if students can develop strategies:
  • Change the number of starting marks
  • Change the number of marks allowed to be removed
  • Play with 3 players (actually, I’ve never tried this…)
THE HOT SEAT
I posted about the Hot Seat game recently.  Time to reveal the secrets to this interesting pattern game –
Data

This table shows the winning chair in the game, based on the number of chairs which start the game.  Note that if the number of chairs is a power of 2, the winning chair will equal the number of chairs.  From any multiple of 2, the winning chair goes up by 2, until the next power of 2 is reached.

How would your students express this pattern?  What vocabulary would they need to use in order to communicate the pattern?  After a class develops the data table, challenge students to write a concise rule which will identify the winning chair.  Then, have students trade their explanations and critique them.

Could an algebra student develop a formula which outputs the winning chair, if the number of chairs is given?  

Take a look at the winning chairs, plotted vs the number of chairs.  Can we write a function which follows the pattern?  Share your function ideas in the comments, and enjoy the challenge.

Plot