Categories
Algebra High School Technology

Activity Builder – Classroom Design Considerations

This past summer, our forward-thinking math-teacher-centric friends at Desmos released Activity Builder into the wild, and the collective creativity of the math world has been evident as teachers work to find exciting classroom uses for the new interface. Many of these activities are now searchable at teacher.desmos.com – you’re welcome to leave now and check them out – but come back…please?

Its easy to get sucked in to a new, shiny tech tool and want to jump in headfirst with a class. I’ve now created a few lessons and tried them with classes which range from the “top” in achievement, to my freshmen Algebra 1 students. In both cases, I’ve settled upon a set of guiding principles which drive how I build a lesson.

  • What do I want students to know?
  • What path do I want them to take to get there?
  • How will my lesson encourage proper usage of math vocabulary?
  • What will I do with the data I collect?
  • How does this improve upon my usual delivery?

It’s the last question which I often come back to. If making a lesson using Activity Builder (or incorporating any technology, for that matter) doesn’t improve my existing lesson, then why am I doing it?


One recent lesson I built for my algebra 1 class asked students to make discoveries regarding slopes and equations of parallel and perpendicular lines. Before I used it with my class, a quick tweet 2 days before the lesson provided a valuable peer-review from my online PLC.  It’s easy to miss the small things, and some valuable advice regarding order of slides came through, along with some mis-types. The link is provided here in the tweet if you want to play along:

The class I tried this with is not always the most persistent when it comes to math tasks, but I was mostly pleased with their effort. Certainly, the active nature of the activity trumped my usual “here are bunch of lines to draw – I sure hope they find some parallel ones” lesson.

As the class finished, I called them into a small huddle to recap what we did. This is the second lesson using Activity Builder we have done together.  In the first, the students didn’t know I can see their responses, nor understand why it might be valuable.  In this second go-round, the conversation was much deeper, and with more participation than usual. In one slide, the overlay feature allowed us to view all of our equations for lines parallel to the red line:

parallels

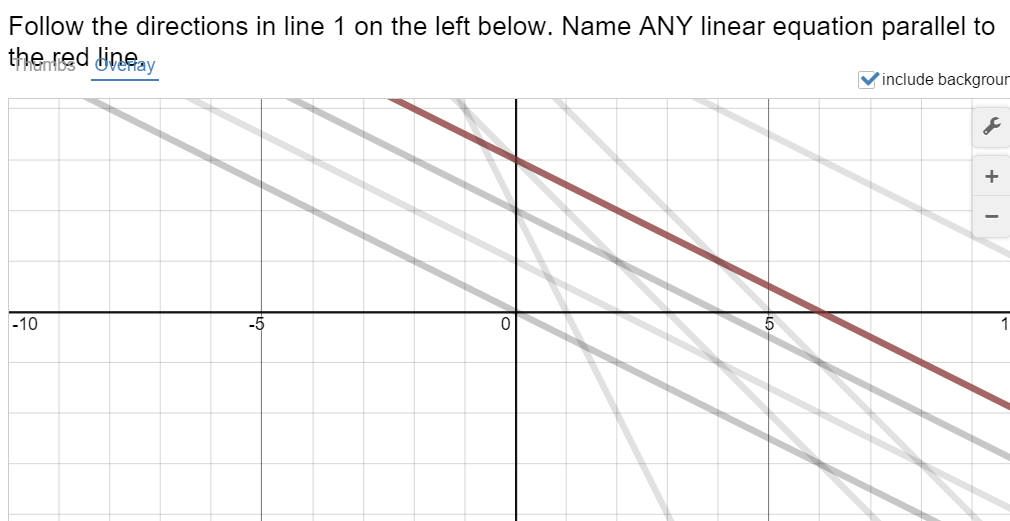
We could clearly see not only our class successes, but examine deeper some misunderstandings.  What’s happening with some of those non-parallel lines?  Let’s take a closer look at Kim’s work:

Parallel 2

What’s going on here? A mis-type of the slope? The students were quite helpful towards each other, and if nothing else I’m thrilled the small group conversation yielded productive ideas in a non-threatening manner – it’s OK to make errors, we just strive to move on and be great next time.  The mantra “parallel lines have the same slope” quickly became embedded.

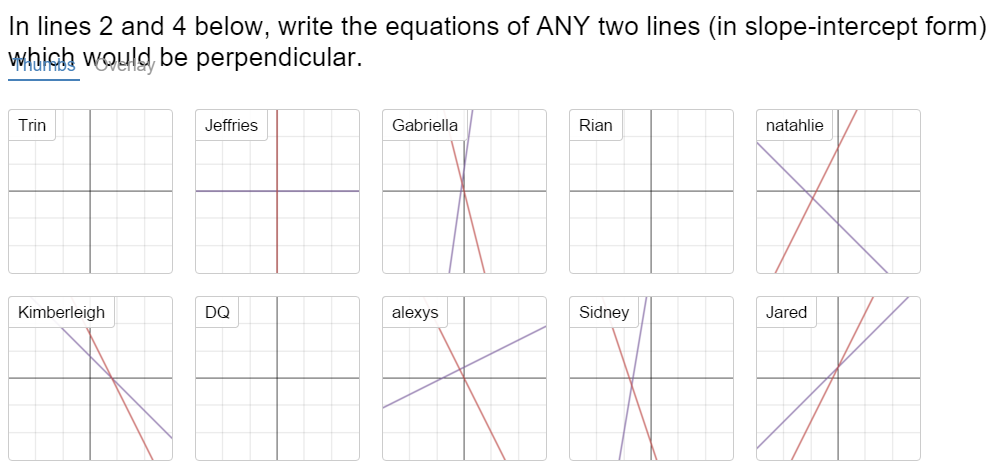
The second half of the lesson was a little bumpier, but that’s OK.  Before questions regarding slope presented themselves in the lesson, storm clouds were evident when the activity asked students to drag a slider to build a sequence of lines perpendicular to the blue line.  Observe the collective responses:

perp2

So, before we even talk about opposite reciprocal slopes, we seem to have a conceptual misunderstanding of perpendicular lines.  I’m glad this came up during the activity and not later after much disconnected practice had taken place.  In retrospect, I wish I had put this discussion away for the day and come up with a good activity for the next day to make sure were all on board with what perpendicular lines even look like, but I pressed ahead.  We did find one student who could successfully generate a pair of perpendicular lines, and I know Alexys enjoyed her moment in the sun.

perp1

What guiding principles guide you as you build activities using technology? How do they shape what you do?  I’m eager to hear your ideas!


Categories
High School Middle School Statistics

Estimation and Anchoring

A recent post by my Stats-teacher friend Anthony, “Wisdom of the Crowd“, reminded me of an estimation activity I have used many times in my 9th grade Stats class.  The activity is based on a chapter from John Allen Paulos’ book A Mathematician Reads the Newspaper.

You’ll need two groups of students; 2 different classes will do.  Each student uses an index card or a scrap of paper to write responses to 2 survey questions. I warn the students beforehand that the questions may seem strange: just do your best to answer as best you can.

  • Question 1: Do you believe the population of Argentina is MORE or LESS than 10 million people?
  • Question 2: Estimate the population of Argentina.

Allow a few moments between the questions for the inevitable blank stares and mumbling.  Then collect the responses.

For the second group, you will ask the same two questions, except that the first question will replace 10 million with 50 million.  After you have data from both groups, write it on the board or print it and hand it out. It’s time to analyze and compare. Challenge students to communicate thoughts about center and spread. Also, which group’s data do they feel does a better job of estimating question 2?  It’s a neat activity, and while you will receive some strange responses as estimates, and students will generally guess higher on question 2 if they have been anchored to the 50 million number.  Some guidelines for this activity are avilable.  Have fun!

According to Google, the actual population of Argentina is around 41 million.


Categories
High School Statistics

When Student Choice is a Struggle

Like most of the East Coast, schools here still have quite a ways to go before enjoying summer. I see my students for one more full week before final exam review begins and finals are given; a time which becomes more crazy as I travel to Kansas City for the AP Stats reading (or…Stats Christmas in June!)

It’s a starange time of year for AP Stats.  The College Board exam was given on May 9, and students took a final exam in my class before then, so we have been done with new material for some time now.  With a full 3 weeks (or more) between the exam and the end of the school year, it’s a time to take my foot off the gas from day-to-day material, but I still need to see my kids engaged in statistics.  Our culminating event, Stats Fair, provides a chance to highlight our program and keep the statistical ball rolling.  There’s really only one requirement for Stat Fair: design a project of your choosing which serves as evidence of your statistical learning. At the Fair, students show off their work to invited guests and fellow students (you can see pictures from previous fairs on my school website).  Teams must also provide printed documentation of their project to me.  It’s a great opportunity to be creative, study something you are passionate about, and explore something new.  There’s just one little problem…

Most student project ideas suck

Yep.  After a year of learning about experimental design, the role of randomness, and all sorts of nifty confidence intervals, many of my 17 year-old students will revert back to their 6th grade dopplegangers; proposing scientific studies of their peers’ favorite colors or chocolate chip cookie preference or how much honors’ kids backpacks weigh. Sigh….

Maybe I’m just jaded.  I warn the students early-on that it is likely I will reject their first 5 stats fair ideas.  It’s not that I am intentionally trying to be mean, rather I want my students to pick something memorable, something they could speak passionately about in front of others.  Working with students to develop their concepts could be the most frustrating part of my academic year.  Why is it so difficult for students to develop a “good” concept?

  • Despite a year full of examples and articles, it’s still a tough leap to the “real world” of teenagers.
  • Developing a good concept takes deep thought, revision, patience and reflection; not always teenage qualities.
  • The best concepts often contain a high dose of creativity – not something we are always accustomed to in math class.
  • It’s the end of the year, and the beach awaits

But all is not lost!  Today’s class started with a rousing success: a student, who had earlier proposed a study of NBA player ages (which was going nowhere), finally moved towards one of his passions – music. Using an app on his iphone, he tested the ability of peers to detect high and low pitches in mHz.  This led him today to some independent study online of the human ear, and reflection on the data he had gathered.

Another group is using their passion for fashion to see just how “skinny” jeans are these days, comparing waist sizes from different stores.  Some interesting data coming from this.  Another group is testing the “locally grown produce” claim of supermarkets…neat stuff!  And I’m looking forward to the random study of our school’s wireless device access – just how slow is it?  It’s the interesting projects which keep me coming back, and make this class memorable – like the team a few years back who entered and won the American Stats Association poster competition with their Bacterial Soap review.

Stats Fair is next Friday.  Look forward to sharing pictures and reflections!