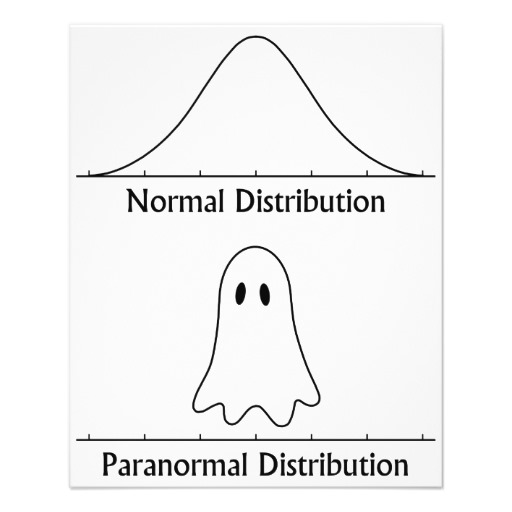
Usually my openers here on the blog are those I share with my freshman classes, but today’s post features my AP Statistics class. They are preparing for their test on normal distributions, and it’s no time to be spooked! Today’s class started with the famous stats cartoon shown here, and an entrance ticket – one part of a past AP problem dealing with normal distributions.
Schools in a certain state receive funding based on the number of students who attend the school. To determine the number of students who attend a school, one school day is selected at random and the number of students in attendance that day is counted and used for funding purposes. The daily number of absences at High School A in the state is approximately normally distributed with mean of 120 students and standard deviation of 10.5 students.
(a) If more than 140 students are absent on the day the attendance count is taken for funding purposes, the school will lose some of its state funding in the subsequent year. Approximately what is the probability that High School A will lose some state funding?
The full exam (and all free-response questions) are available on the AP Statistics area on the College Board website, who own the copyright on all AP problems.
Despite the length of text in this problem, part a here is a simple normal distribution probability, one which any AP student should be able to tackle easily.
I gave students 4 minutes to provide a solution on the printed sheet, but did not ask them to identify themselves on the paper. After collecting the sheets, I mixed them up and prepared to share them under my document camera. This particular problem is one I graded last summer at the AP Stats reading in Kansas City, and if you know what you are looking for, it is a quick grade (by my super-unofficial count, I probably graded this question about 1500 times). All papers received a score of E (essentially correct), P (partially correct) or I (incorrect) based on the College Board rubric. Even though this would qualify as an “easy-ish” problem in AP Stats, it’s still the student’s responsibility to justify and communicate. For this problem, there are 3 features we AP readers looked for:
- A correct answer
- Indictation of a normal distribution used, along with mean and standard deviation identifiction
- Indictation of a boundary value of 140
The last 2 bullets could be met in a number of ways – by diagram, by symbols. It’s a good lessson to students that even basic stats problems require justification.
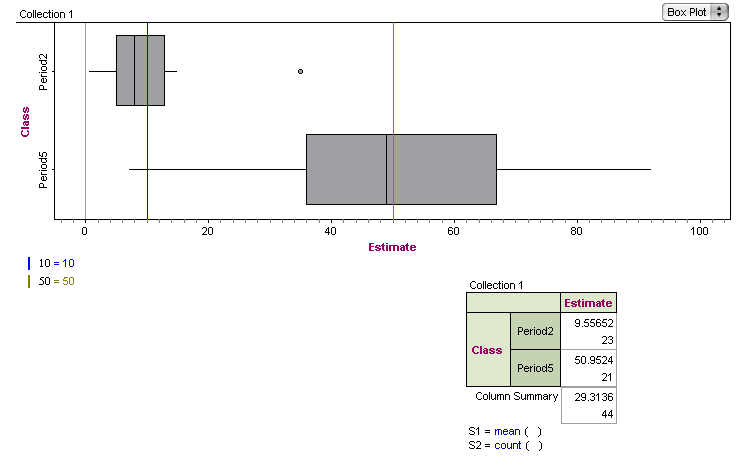
 We’re thinking about standard deviation in my 9th grade class, and the idea of variation and “unusual” data points. I think the picture which greeted students today says just about all which needs to be said on standard deviation, doesn’t it?