Categories
Algebra High School

Last Week I Refused to Teach Factoring

The students in my Freshman Honors class have certain expectations for how a math class works – a teacher lectures, there’s lots of drill practice, and then a test. Breaking this mold, and causing them to think of themselves as reflective learners, is one of my many missions. So this past week, when confronted with factoring, I simply refused to lecture.

My 9th graders have seen factoring before, but it was back in 7th grade, and it was only a surface treatment. So after a brief opener where we discussed what a “factor” means (both numerically and algebraically), I dropped the bomb –

  • I’ve posted your learning targets online
  • I’ve posted videos, resources and practice problems if you need them
  • I’ve set up online practice if you need it
  • You have a timed quiz on Friday (we started on Tuesday)

And….scene!

Panic….apprehension….incredulous looks….

So, you’re not going to teach us?

Nope.  Now get to work.

Here are some details of what I posted:

LEARNING TARGETS

  • F1: I can identify and factor expressions which involve greatest common factors.
  • F2: I can efficiently factor trinomials of the form ax2+bx+c, where a = 1.
  • F3: I can factor trinomials of the form ax2+bx+c, where a does not equal 1 (or zero).
  • F4: I can identify and factor perfect square trinomials.
  • F5: I can identify and factor “difference of squares” expressions.
  • F6: I can factor expressions which may represent a combination of F1 to F5.
  • F7: I can factor expressions “by parts” (or “by grouping”) when necessary.
  • F8: I can factor expressions which are the sum (or difference) of two cubes.

RESOURCES

Each learning target featured a video – some from Khan Academy, and some from other sources I searched for – but I attempted to provide a variety of methods. Some featured grouping as a primary means, others demonstrated the box method or the diamond.  This was the most important aspect of this learning experience: I wanted students to experience a variety of approaches, evaluate them, and make a personal decision about what worked best for them.  The students did not disappoint.

I also posted other online resources, such as worked examples and flowcharts.  One of my favorite resources – Finding Factors from nrich, was also included. Finally, I created an assignment on DeltaMath for each learning target, and a final jumbled assignment. The end of each day featured an exit ticket quiz and recap, to assess progress and provide “next steps” during the week.

SO WHAT HAPPENED?

Some students latched onto factoring by grouping for every quadratic, and explained their reasoning to their peers.  Many of these same students later in the week found more confidence in their number sense and chose to group only for “tricky” problems. One student was particularly insistent that the box method was the best was to go for all problems. Others found the diamond method helpful – which led to deep conversations about number sense and how to make searches more efficient. And in one fascinating conversation, a student discovered a “trick” he had found online. The group debated the merits of the method, tried some practice…but as nobody in the group could figure out why the method worked, they quickly dismissed it.  Good boys!!!

In the end, the quiz scores were great.  But beyond the scores, I feel confident that the students have made choices about their learning, assessed and revised their thinking, and can move forward using their new tools.

WHAT DID THE STUDENTS THINK?

Today I asked students to reflect upon their learning experience, and provide me feedback.

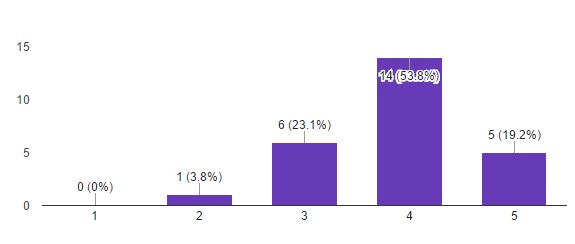
What was your overall feeling about last week’s learning method?  (1 = “Please never do that again”, 5 = “I loved it – do it more”.)

chart

Describe something you LIKED about last week’s classes, and why you liked it.

  • I liked being able to choose what i wanted to do. I could focus on my weaknesses and do less problems on what i was good at. I also appreciated the practice problems.
  • I liked that if you knew a topic you could move on and didn’t have to wait for someone else or the next day of class.
  • I liked that I could learn and do problems at my own speed.

Describe something you DIDN’T LIKE about last week’s classes, and why you didn’t like it.

  • I did not like that you did not explain how to factor
  • I didn’t have as much instruction from the master of factoring. {note – I suppose this is me?}
  • the teacher wasn’t involved

This last comment intrigues me…and I’m not sure if I should be bothered by it…I don’t think I should be.  In many respects, I feel I worked harder during the classes, as students were all over the place.  But I also realize students don’t see all of this going on around them.  I’ve become intrigued by how I can be less of a teacher and more of a facilitator in my classes, and this was a solid step forward I feel.

Now, off to plan to not lecture tomorrow….

Categories
Class Openers High School

How I Stumbled Into Math Modeling Without Even Realizing It.

We started a unit on counting principles this week in my 9th grade honors class – permutations, combinations – eventually leading to the binomial theorem.  Since my  classes had used Desmos Activity Builder a few times and were familiar with the need to enter a 5-character code to start an activity, I planned to ask the following question as a class opener:

How many different 5-character DesmosActivity Builder codes exist?

codes

This problem would have likely met my intended goal of having kids think about the fundamental counting principle in a real-world context.  It also would have taken about 10 minutes of class time, and have been forgotten about by the next day.  It felt like I was missing an opportunity to develop a deeper discussion.  A slight tweak to the question added just the right layer:

Activity codes for Desmos Activity Builder currently have 5 characters, as shown here.  When will Activity Codes need to expand to 6 characters?

And now we have a problem which requires a bit more than a quick calculation.  To start, I asked students to work in their teams to make a list of information they would need to help solve this problem.  This was not easy or comfortable for them – but a preliminary list of questions emerged from group discussions:

  • How many 5-character codes are there?
  • Are codes used less on weeekends and summers?
  • Can letters repeat in codes?
  • How many codes a day are used?

This was a good start to set kids in motion to think about how to solve the problem.  I’m hoping they will think about new questions or revise their questions as we go along…the class did not disappoint!

HOW MANY CODES ARE THERE?

As kids worked, clarifying questions came up – some of which I just didn’t know the answer to, and hadn’t really thought about:

Mr. L, are there any zeroes in codes? Kids might confuse them with the letter O.

Mr. L, I don’t see any L’s in the codes?

Excellent observations, and restrictions we need to think about in our calculation. A tweet to the Desmos crew lent some clarity, and added more restrictions!

https://twitter.com/eluberoff/status/806304359331921920

Thank for the intel, Eli!

HOW MANY CODES PER DAY ARE USED?

This was tricky for my class. To help, I reminded students that when we started the semester, codes were 4 characters.  When did the Desmos 5-character era begin?  A quick scroll through my history (shown here) provides some info. After further interrogation from my class, I shared that Activity Builder started around July of last year with 4-character codes.  Add this to our bucket of helpful info.

codes2

SHARING IS CARING

Writing a draft solution was the next task for students.  But instead of turning it in to me immediately, I formed class teams of 3 where students shared their drafts and ideas.  I used this opportunity to build teams of students who I observe don’t often interact or chat.  From here, I gave students another day to think about their explanation – keeping in mind that there are no right answers to this question, only answers we can defend. But it still feels like we are missing a key piece in this problem……

DID WE MISS ANYTHING?

The next morning as students were mingling before the bell, I looked across the room at the laptop of Jacob – one of my more insightful, but also introverted, students:

trends

It’s the mother lode!

The google trends graph for student.desmos.  Yes! Yes! Yes!  Stop everything kids, we need to talk!  Jacob – tell us all about this graph. How does this new info factor into our estimates?  What should we do with it?  Is this going to continue?  And with this, I gave the class an extra day to think about their responses, share, and dig deeper.  And while many students simply estimated a growth rate by doubling or tripling their computed rate (this is fine with me), I am getting some responses which far exceed my expectations – like Jacob, who developed a growth function and evaluated integrals (did I mention this is a 9th grade class????)

jacob.JPG

Yep, this was definitely better than my originally intended problem!


Categories
Statistics Technology

Seeing Stars with Random Sampling

Adapted from Introduction to Statistical Investigations, AP Version, by Tintle, Chance, Cobb, Rossman, Roy, Swanson and VanderStoep

Before the Thanksgiving break, I started the sampling chapter in AP Statistics.  This is a unit filled with new vocabulary and many, many class activities.  To get students thinking about random sampling, I have used the “famous” Random Rectangles activity (Google it…you’ll find it) and it’s cousin – Jelly Blubbers. These activities are effective in causing students to think about the importance of choosing a random sample from a population, and considering communication of procedures. But a new activity I first heard about at a summer session on simulation-based inference, and later explained by Ruth Carver at a recent PASTA meeting, has added some welcome wrinkles to this unit.  The unit uses the one-variable sampling applet from the Rossman-Chance applet collection, and is ideal for 1-1 classrooms, or even students working in tech teams.  Also, Beth Chance is wonderful…and you should all know that!

starsIn my classroom notes, students first encounter the “sky”, which has been broken into 100 squares. To start, teams work to define procedures for selecting a random sample of 10 squares, using both the “hat” (non-technology) method, and a method using technology (usually a graphing calculator). Before we draw the samples however, I want students to think about the population – specifically, will a random sample do a “good job” with providing estimates? Groups were asked to discuss what they notice about the sky.  My classes immediately sensed something worth noting:

There are some squares where there are many stars (we end up calling these “dense” squares) and some where there are not so many.

Before we even drew our first sample, we are talking about the need to consider both dense and non-dense areas in our sample, and the possibility that our sample will overestimate or underestimate the population, even in random sampling.  There’s a lot of stats goodness in all of this, and the conversation felt natural and accessible to the students.

Studestars1nts then used their technology-based procedure to actually draw a random sample of 10 squares, marking off the squares.  But counting the actual stars is not reasonable, given their quantity – so it’s Beth Chance to the rescue!  Make sure you click the “stars” population to get started.  Beth has provided the number of stars in each square, and information regarding density, row and column to think about later.

But before we start clicking blindly, let’s describe that population.   The class quickly agrees that we have a skewed-right distribution, and take note of the population mean – we’ll need it to discuss bias later.

Click “show sampling options” on the top of the screen and we can now simulate random samples.  First, students each drew a sample of size 10 – the bottom of the screen shows the sample, summary statistics, and a visual of the 10 squares chosen from the population.

stars2.JPG

Groups were asked to look at their sample means, share them with neighbors, and think about how close these samples generally come to hitting their target.  Find a neighbor where few “dense” area were selected , or where many “dense” squares made the cut, how much confidence do we have in using this procedure to estimate the population mean?

Eventually I unleashed the sampling power of the applet and let students draw more and more samples.  And while a formal discussion of sampling distributions is a few chapters away, we can make observations about the distributions of these sample means.

stars3

And I knew the discussion was heading in the right direction when a student observed:

Hey, the population is definitely skewed, but the means are approximately normal.  That’s odd…

Yep, it sure is…and more seeds have been planted for later sampling distribution discussions. But what about those dense and non-dense areas the students noticed earlier?  Sure, our random samples seem to provide an unbiased estimator of the population mean, but can we do better?  This is where Beth’s applet is so wonderful, and where this activity separates itself from Random Rectangles.  On the top of the applet, we can stratify our sample by density, ensuring that an appropriate ratio of dense / non-dense areas (here, 20%) is maintained in the sample.  The applet then uses color to make this distinction clear: here, green dots represent dense-area squares.

stars4

Finally, note the reduced variability in the distribution from stratified samples, as opposed to random samples. The payoff is here!

Later, we will look at samples stratified by row and/or column.  And cluster samples by row or column will also make an appearance.  There’s so much to talk about with this one activity, and I appreciate Ruth and Beth for sharing!