Free-response questions and exam information in this post freely available on the College Board – AP Statistics website
Today I am stealing a concept from Dan Meyer’s task comparison series “Who Wore it Best”, and bringing it to the AP Statistics exam world. In the series of 6 free-response questions on the AP Stats exam, it is not unusual for one question to focus solely on inference. Compare these two questions, which each deal with inference for proportions.
From 2012:
From 2016:

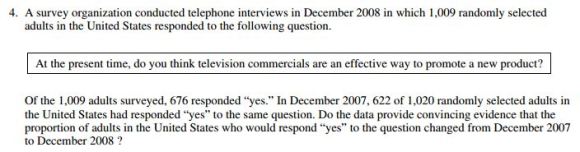
I read (graded) the question from 2012 as an AP Exam reader, and observed a variety of approaches. I find that while many students understand the structure of a hypothesis test, it’s the nuance – the rationales for steps – which are often lost in the communication. In the 2012 question, students were expected to do the following:
- Identify appropriate parameters
- State null and alternate hypotheses
- Identify conditions
- Independent, random samples and normality of sampling distribution
- Name the correct hypothesis procedure
- Compute / communicate test statistic and p-value
- Compare the p-value to an alpha level
- Make an appropriate conclusion in context of the problem
It’s quite a list. And given that individual AP exam problems are worth a total of 4 points, steps are often combined into one scoring element. Here, naming the test and checking conditions were bundled – as such, precision in providing a rationale for conditions was often forgiven. For example, if students identified the large sample sizes as a necessary condition, this was sufficient, even if there was no recognition of a link to normality of sampling distributions. Understanding the structure of a hypothesis test – with appropriate communication – was clearly the star of the show. While inference is one the “big ideas” in AP Statistics, my view is that questions like this from 2012 encourage cookbook statistics, where memorized structure take the place of deeper understanding.
So, it was with much excitement that I saw question 5 from 2016. Here, the interpretation of a confidence interval was preserved. But I appreciate the work of the test development committee in parts b and c; rather than have students simply list and confirm conditions for inference, the exam challenges students to be quite specific about their rationales. With parts b and c, students certainly struggled more than with the conditions in 2012, but I hope their inclusion causes statistics teachers to consider their approach to hypothesis conditions. The mean scores for each question speak to struggles students on this question, compared to traditional hypothesis testing structure.
- 2012: 1.56 (out of 4)
- 2016: 1.27 (out of 4)
The inclusion of part b of question 5 this year, where students were asked to defend the np > 10 condition, was perfect timing for my classes. This year, I tried a new approach to help develop student understanding of the binomial distribution / sampling distribution relationship. I found that while many students will continue to resort to the “short cut” – memorizing conditions – a higher proportion of students were able to provide clear communication of this inference condition.
The AP Statistics reading features “Best Practices Night” – where classroom ideas are shared. You can find resources from the last few years at Jason Molesky’s APStatsMonkey site. I shared my np > 10 ideas with the group, and received many positive comments about it. Enjoy my slides here, and feel free to contact me with questions regarding this lesson:
Finally, I can’t express how wonderfully rich a professional-development experience the AP reading is. I always find myself with a basket of new classroom ideas and contacts to share with – it’s stats-geek Christmas. For me, 2016 is the year the #MTBoS started to make its mark at the Stats reading – I met so many folks from Twitter, and we held our first-ever tweet-up!
Also, the vibrant Philadelphia-area stats community was active as always. We meet as a group a few times a year to share ideas and lessons; seeing so many from this area participate in the reading makes us all better with what we do for our students.
 High school teachers may be intrigued by Graham’s discussion of fractions, reducing and equivalence and the role of “simplifying”. His talk has caused me to think about the many odd restrictions we place on student work: i.e. “write the equation of your line in standard form”, and their necessity in my math story. Graham’s call to action – challenging teachers to identify their own “simplifying fractions” (something they teach not currently in the standards) – is an appropriate task for all grades.
 In the activity, students first consider seats in a theater, which leads to a review of linear function ideas. Vocabulary for arithmetic sequences is introduced, followed by a formal function for finding terms in a sequence. It’s this last piece, moving to a general rule, which worried me the most. Was this too fast? Was I beating kids over the head with a formula they weren’t ready for? Would the notation scare them off?
 The path – having students move from a context, to prediction, to generalization, to application – was navigated cleanly by most of my students. The important role of the common difference in building equations was evident in the conversations, and many were able to complete my final application challenge. The next day, students were able to quickly generate functions which represent arithmetic sequences, and with less notational confusion than the past. It certainly wasn’t all a smooth ride, but the improvement, and lack of tooth-pulling, made this a vast improvement over my previous delivery.
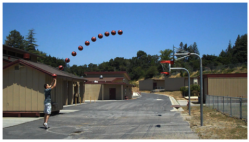 Dan Meyer’s “Did It Hit the Hoop” 3-act Activity probably sits on the Mount Rushmore of math goodness, and Dan’s recent share of an Activity Builder makes it all the more easy to engage your classes with this premise. In class, we are working through polynomial operations, with factoring looming large on the horizon. My 9th graders have little experience with anything non-linear, so this seemed a perfect time to toss them into the deep end of the pool. The students worked in partnerships, and kept track of their shot predictions with dry-erase markers on their desks. Conversations regarding parabola behavior were abundant, and I kept mental notes to work their ideas into our formal conversations the next day. What I appreciate most about this activity is that students explore quadratic functions, but don’t need to know a lick about them to have fun with it – nor do we scare them off by demanding high-level language or intimidating equations right away.