Categories
Class Openers Statistics

Class Opener – Day 36 – Introverts vs Extroverts

We’re about half-way through a basic stats unit in my 9th grade class, with a quiz tomorrow on standard deviation and the normal distribution.  I need one last class example to have students compare and contrast data sets by looking at their centers and variability.  A morning brainstorm turned into a fun exploration of my students’ personalities.  3 groupings were shown my back whiteboard:

  • EXTROVERTS
  • MIDDLE
  • INTROVERTS

After a brief discussion of what it means to be introverted or extroverted, and doing my best to steer discussion away from any negative connotations, I asked students to self-identify and move to a corner of the room based on where they see themselves.  To clean up things some, I told them to arrange themselves so that we had exactly 8 introverts and 8 extroverts, with everyone else in the middle.  Some adjusting then took place, as we agreed on who belonged in which group.

Now for the data collection aspect.  I had each student approach the back board and write their signature in the appropriate column.  This is where the fun began – as my introverts calmly waited for their peers to write their names and move away, the extroverts fought over markers and board space.  As students sat down after contrubiting their signature, some noticed immediately what was happening :

classdata

After all names were written, and we had a good laugh over the clear differences in the categories, we needed some data.  Each student approached the board and measured the height of a name at its tallest point, recording to the nearest tenth of a centimeter.  Tonight’s homework is then to compute the standard devation “by hand” for one of the groups, and comment on differences.  My old friend the Nspire App is helpful here to show the clear difference between the introverts and the extroverts:

graphs
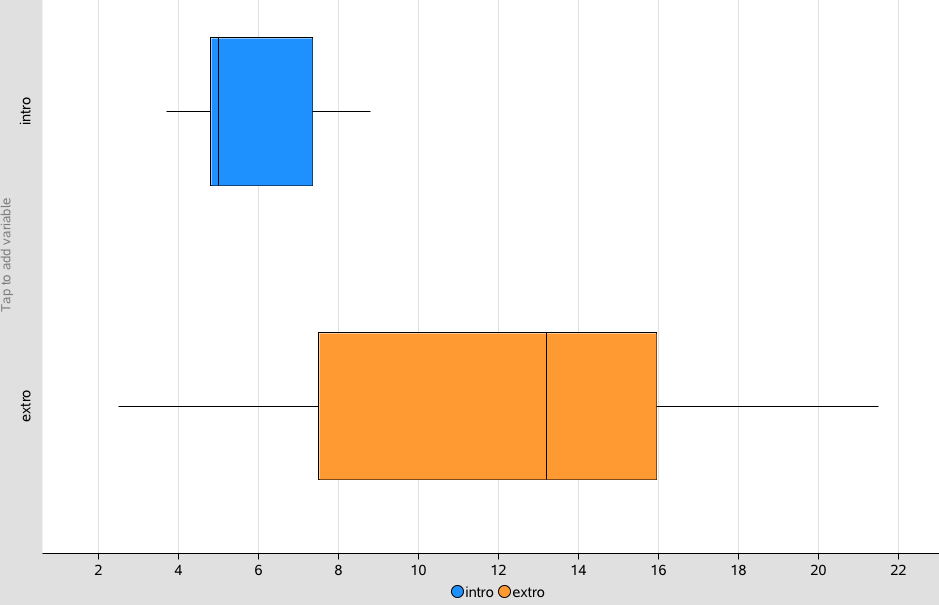
Using authentic data in class matters, as kids more readily discuss what they see and are generally more eager to dig deeper into a problem.  This was a fun way to culminate the first half of our stats unit.

Categories
Uncategorized

A Surprising Harmonic Series Result

If you are a loyal followed of the blog (and I know you are!), you’ll notice there was no class opener this past Friday.  This is because I was not in school, and instead traveled about an hour north of my home to New Brunswick, NJ. for the Association of Math Teachers of New Jersey annual conference. I facilitated a fun hour of tech tools for math class (Padlet, Poll Everywhere, Answer Garden, etc…) and couldn’t help myself but to unveil Desmos regressions to an appreciative group of Desmos lovers.

But the highlight of the day was my participation in an Ignite session, hosted by my friends at the Drexel Math Forum. 10 speakers each had 5 minutes to get their ideas across through 20 slides which changed every 15 seconds. It’s a fun an intimidating concept!  Some of those who shared during the Ignite were Max and Annie from the Math Forum, Phil Daro, past NCTM President Jim Rubillo….and me?  How the hell did I get invited to present with a group of people I admire so much?  I think my topic, language in math class (based on a past blog post on math phrases I’d like to see expunged) went over well, and I look forward to sharing the video when it becomes available.  It’s probably the most thrilling experience I’ve had as a speaker.


But the fun math times continued after the Ignite session, when Jim Rubillo and I shared a conversation about the exciting role of technology in math class, and its ability to allow students to investigate ideas efficiently.  It turns out that Jim lives about 10 minutes from me (small world) and he shared a math idea from his (I think) college math course where students used technology to pursue an idea.

This particular investigation involves the Harmonic Series, which I have shared with my freshmen classes recently:

Harmonic

This series diverges, heading off towards infinity – though quite slowly, and Jim’s students investigated when the series passed integer values. How many terms does it take for the series to go above 3, or 4, or 5, etc?  Some examples:

  • When n=4, the sum climbs above 2
  • When n=11, the sum climbs above 3
  • When n=83, the sum climbs above 4
  • When n=227, the sum climbs above 5

Technology was uber-useful here, as a Desmos graph (click the picture to the right to explore) allowed me to observe the sum, and use a Floor function to watch when the next integer value is reached.  A table was also useful to verify the changes in sum.

This was all done after I went home that day, and it was Jim’s next challenge when had me intrigued:

If you look at the n’s where the sum reaches a new integer value, and find the ratio of these consecutive n’s, you’ll never guess what the ratio approaches.

Well, in math, there are lots of surprising results, and many of them seem to involve a few “usual suspects”.  I really had no idea what those number might approach – but I had a good guess: “I bet it’s e”.

Yes! It’s e!!! Shared Jim excitedly, with a pretty good punch to the arm.

harmonicSome quick calculations involving these landmark n’s seem to lend some evidence towards Jim’s claim.  It’s an idea he said he had never seen before, and I don’t recall encountering it.  But Jim did find some documentation regarding a proof, but couldn’t recall where it was located.  If anyone out there has more info to share, please contribute in the comments!

In the end, Friday was just an awesome day of sharing, and fun to talk one-on-one with some legends in the math education community.

Categories
Class Openers Statistics

Class Opener – Day 35 – Tall and Short

tallshortWe’re thinking about standard deviation in my 9th grade class, and the idea of variation and “unusual” data points. I think the picture which greeted students today says just about all which needs to be said on standard deviation, doesn’t it?

Later in class, I asked students to plot their heights on a number line I had drawn, with a low of 60 inches and a high of 74.  From here, I asked students to estimate what our class standard deviation might be.  Some interesting responses were generated:

  • 10 – probably because 60 and 70 appeard on the line.
  • 5 – because that would seem to cover the number line

When I reminded them that standard deviation can be thought of as “typical distance from the mean”, the responses evolved and eventually we settled on between 2 and 3, where travelling 2 standard deviations in each direction would cover everyone in the class.  Next, when I told them that the World’s Tallest Man had a height over 8 standard deviations from the mean, meaningful gasps were shared, and we could move on to notes onvolving the normal distribution.

Short post today as I am about to start 23 parent conferences over 6 hours….wish me luck!