Fred can paint a room in 5 hours, working alone. His friend, Joe, can paint the same room in 7 hours. How long will it take for them to paint the room, working together?
It’s a shared-work party, people! Get your party hats on and let’s look at a visual method for exploring these often mundane problems. This past summer at Twitter Math Camp, I participated in an algebra 2 group where part of our time was spend considering methods to re-think the traditionl approach to rational functions and their applications. Thanks to John Berray for the great conversations, which led to some changes in how I appoached shared work problems this year.
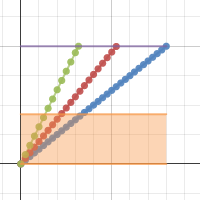
My approach this year started similarly to previous years: guiding a dicussion with the class, with the goal of developing models for the amount of work done by each painter. I find that quesitons like “How much of the job will fred have complete after 1 hour? 2 hours…etc” will usually lead to the models we seek. What I did differently this year was graph the two work functions. Using the Desmos calculator works nicely, and allowed for a discussion of the problem much richer than if the expressions had been just jotted down on the board. Many students followed along on their TI calculators.

From here, we can make connections betweem the functions, their graphs, and make conjectures about the sum of these functions.

In my class, students certainly completed similar problems (including distance / rate / time), with the graphs serving as a check and visual affirmation. With the graphs, we could also look at adaptations to the theme, such as “what happens if one of the painters shows up 2 hours late?”

Also, problems where the combined time was given, with the goal of finding a missing individual rate, were explored and discussed.

Click the icon below to play with this model on your own. This is a great opportunity to let students observe function behavior and communicate results from a graph.

UPDATE: The Desmos folks flew with this one, and added a whole bunch of bells and whistles. Click the graph below to experience their shared-work extravaganza.