Categories
Algebra Geometry Middle School Technology

Doing the Translation Dance

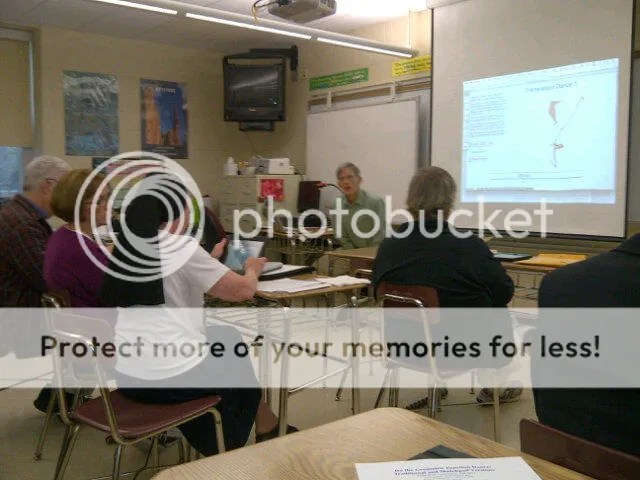
Last month, I wrote about my talk on Encouraging Perseverance in Math Class, given at the Fall, 2012 ATMOPAV conference.  But earlier that same day, I had the opportunity to hear Scott Steketee‘s thoughts on functions: “Function Dances: Using Transformations to Make Variables Vary and Functions Behave”.

Steketee

I have found that the approach many teachers take to functions is one of notation only.  That by simply introducing the f(x) and g(x) symbols, and “covering” domain and range, algebraic functions will be understood.  Scott’s presentation provided ideas for introducing the concept of  function, without all of the scary symbols, through dynamic Sketchpad files.  The group worked through a number of progressively intricate functional relationships on iPads.  In this first example, students can grab points and look for relationships.  Some points will not move when dragged, as they are “dependent” upon other points’ movements.    Also, the dependencies vary, from simple linear relationships, to a few which require dilations or reflections.

iPad1

Later, we were introduced to the Sketchpad “Translations Dances”.  As one point (below, the point on the green outline) travels about its “domain”, we are challenged to trace the “range” of the translated point p.  These start off innocently enough, but become more diabolical as the translations begin to include reflections and rotations.

iPad2

These were addictive and appropriate uses for the iPad, and I was able to easily load the files into iPad’s Sketch Explorer through my DropBox account.

The second half of Scott’s talk was more kinesthetic, social, and potentially embarrassing, as the group split into partnerships to choreograph dances based on transformations.  My partner acted as the independent variable, and I (the dependent variable) followed her actions, using lines in the floor to act as  axis of reflection.  This would be a fun way to expose kids to functional ideas, but I made sure that no photographic evidence of my dancing ability exists!

What I appreciated most about Scott’s sketches and dances is that they allow teachers to develop functional ideas without having to wade through all of the complex language.  Through play and exploration, students can summarize their observations, and begin to characterize the relationships.  As students begin to understand the relationships between variables, we then can discuss the need to have special notation to express them.  Finally, dilations and reflections, which are often over-looked in our curriculum, become the stars of the show through fun (and addicting) Sketchpad games.  My screen grabs here certainly don’t do Scott’s files justice, so download them, play around, and enjoy the dances!

Categories
Middle School Technology

Estimation with the QAMA calculator

I first heard about the QAMA calculator a few weeks ago, and was immediately intrigued.  The QAMA website advertises its device as

The revolutionary calculator that shows the answer only when you also enter a suitable mental estimate.

That’s a good enough hook for me, so 5 devices were ordered, and I had the first chance to work with a group of students using the QAMA calc.  Students in a 7th grade class rotated through learning stations, where working with me on “percentage of a number” problems were a station challenge.

To start, I had students enter the problem 2.8 x 4.9.  Pressing the equals key, students were not given the answer, and instead must give an estimate of the answer.  An answer deemed “reasonable” will then produce the actual answer.  Here, the students agreed that 3 x 5 = 15 would be a reasonable estimate.

From this introduction, we dove into the first percent problem:  what is 78% of 210.  After writing the problem as a decimal multiplication problem, we brainstormed estimation ideas:  75% is close to 78%, and 200 is pretty close to 210 as well.  This led to discussion on parts of 200:  what is 25%, what is half, how much is 75%.  An estimate of 150 was deemed close enough, and the students were hooked.  Students worked at their own pace through the problems, and were excited when their estimate was considered close enough.

Calc 1

One of the trickier problems, and one which caused the most discussion, was 8% of 45.  After agreeing that .08, rather than .80, was needed here, honing in on an estimate was a tough ride.  Can we find 10% of 45?  How much less do we need to shave off?  The calculator apparently adjusts its tolerance based on the sophistication of the problem, so some close answers were not allowed.

This problem also yielded the strangest accepted estimate of the day:

calc 2

If anyone can figure out the logic here, I’d be interested to hear it.  Insight into the complexity of the estimation algorithm can be found on the company’s website.  EDIT:  as the folks at QAMA explained to me, the calculator will simply give you the correct answer after 5 incorrect guesses.  This particular student was all over the map with his guesses, so I would not be surprised if this photo represents his 5th guess.

Also, one feature I like is that you can shut off the estimation feature, but the calculator has flashing red lights to let the teacher know the feature was disabled.  Pretty sneaky!

But, this was a fruitful activity, which allowed students to communicate their number sense, and verify their estimates.  Looking forward to hearing more stories of the QAMA calculator.

Categories
Technology

QR Codes for my Middle School friends

Today, we are having a mini-ed camp at our middle school.  In my sharing session, we are learning about QR codes, where examples are posted all around the room.  As a follow-up, I have made a QR code which links to this post, and hope that my colleagues will scan, visit, and leave a comment.  So, if you attend today, please be sure to leave a comment and share your QR code enthusiasm!

UPDATE – what a great day of sharing, as teachers from all over our building shared their success stories, strategies, and points of pride.  For my session, photos were uploaded to photobucket, then turned into QR code links using qrsuff.  Many attendees installed code readers onto their iPhones, and helped each other work through problems posted on lockers.  In one sample from Social Studies, the printed sheet said “Where was this photo taken, and who is the speaker?”.  Scanning the QR code then produced a photo of the Washington Mall during Dr. King’s “I Have  a Dream” speech.

Thanks to Joe and Sarah for the outstanding leadership in planning this exciting event!

QR1

QR2

QR3