Categories
Technology

Activity Builder Reflections

The super-awesome Desmos folks set Activity Builder into the wild this past summer, and it’s been exciting to see the creativity gushing from my math teaching colleagues as they build activities.  So far, I have used Activities with 2 of my classes, with mixed success.

In my 9th grade Prob/Stat class, I built an Activity to assess student understanding of scatterplots and lines of best fit.  You can play along with the activity if you like: go to student.desmos.com, and enter the code T7TP.  I am most excitied by the formative assessment opportunities an activity can provide – here are 3 places where I was able to assess class understanding.

In one slide, students were shown a scatterplot, and asked to slide a point along a number line to a “reasonable” value for the correlation coefficeient, r.  The overlay feature on the teacher dashboard allowed me to review responses with the class and consider the collective class wisdom.

r overlay

In another slide, students were again given a scatterplot and asked to set sliders for slope and y-intercept to build a best-fit line.  Again, the overlay feature was helpful, though it was also great to look at individual responses.  This led to a discussion of that pesky outlier on the right – just how much could it influence the line?

LSRL overlay

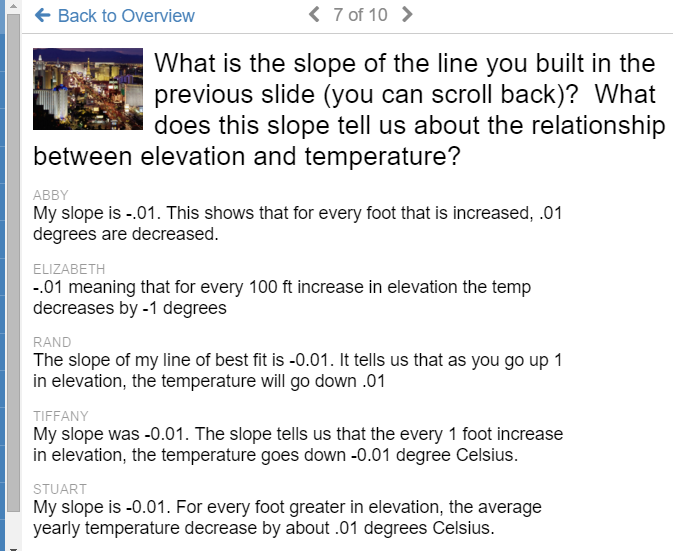
Finally, question slides were perfect for allowing students to communicate their ideas, and focus on vocabulary. In our class debrief, we discussed the meaning of slope in a best-fit line, and its role in making predictions about the overall pattern.

 question roll

But all has not been totally sunny with Activity Builder.  In my Algebra 1 class, I built an Activity to use as a station during class.  Splitting the class in half, one group worked with me on problems, while the rest worked through the activity, then flipping roles halfway through class.  You can try this activity at student.desmos.com, code 3FGM.

Storm clouds approached early, when a student complained that they didn’t know what to do – even though the first slide offered instructions to “Drag the points…”.  Quickly my “I’m an awesome teacher who uses stations” fuzziness turned into saltiness as students clearly were not following the activity faithfully.  Here’s what I learned:

Leading class through an activity beforehand would have been helpful. In the future, I’m going to make a vanilla lesson which walks students through simple tasks – dragging points, answering questions, entering equations, adjusting sliders – and let them see how I can view and use their responses.  Just setting a class into the wild, especially a class which often struggles with instructions, didn’t work so hot.


Last Saturday, I led a group of about 20 teachers in an Activity Builder workshp at the ATMOPAV Fall Conference at Ursinus. I had 3 goals for the assembled teachers for the hour:

  • Experience activities through a student perspective.
  • Experience the teacher dashboard.
  • Start building their own activities.

Some have asked for my materials, and I can’t say I have too much to share.  Check out my Slides and feel free to contact me with questions about the hour. Some highlights of the group discussions:

  • When is the best time in a unit to use an Activity?  So far, I have used it as an intro to a unit, and also as a summary of a unit.  The difference is in the approach to task.  An intro activity should invite students to explore and play, and think about generalizations – include lots of “what do you think?” opportunities.  In my summary activity, I asked specific questions to see if students could communicate ideas based on what we had learned.
  • Think about how you will leverage to teacher dashboard to collect and view ideas.  How does the overlay feature let all students contribute and build class generalizations in a new way?  How will you highlight individual student responses to generate class conversation?
  • Ask efficient questions.  There’s really not a lot of room in the text for long-ish tasks.  Keep things short, sweet, and focused.
  • Many teachers wanted to know more about building draggable points.  The way I do this is to create a table, enter some points, and use the Edit feature to make the points draggable.  Your best bet may be to take an already existing activity and pore through its engine, which reminds me….

Desmos is now assembling an searchable archive of vetted activities.  Go to teacher.desmos.com, and use the search bar at the top-left.  I highly recommend any creations by Jon Orr, Michael Fenton and Christopher Danielson.

copyAnd finally, an exciting new feature to Activity Builder just appeared today – you can now copy slides within an Activity.  Click the 3 dots to duplicate a slide and use it again, or edit a graph to use later.

Categories
Technology

ISTE 2015 – Keep the Learning in Focus

Anytime I do a blog post which is a list, my traffic shoots up.

– A friend / tech-blogger

cuethinkThis post has been rattling around in my head since the end of the ISTE (International Society for Technology in Education) Annual Conference last week. I most appreciated the chance to meet and discuss technology war stories with folks I had only “met” before through twitter, make new connections in the math world, and think about how new ideas and products will change my classroom culture.  But trying to summarize the experience in a blog post is difficult.  There’s just too much stuff – new tools, inspiring people, great school action – how can I fit it all in?

I got it — I’ll make a list!!!

Often, the most popular presentations are those which feature lists – it’s a great device for getting foot traffic to your session.

  • Amazing Chrome Apps and Extensions to Enhance Teaching and Learning!
  • The Magic Bag of New Presentation Tools for Teachers
  • 60 in 60 – App Attack

I confess I enjoyed Steve Dembo’s list session – “Something Old, Something New” – which challenged participants to share tools on Twitter and think about how “old” tools still could be thoroughly effective in the classroom, and not to toss them for new things, while also embracing the new.  Sessions featuring lists can be intoxicating hours of “wow”.

After my session featuring Desmos on day 1, I was energized to think about a session for next year.  There were few math-specific sessions at ISTE, and the group I worked with seemed appreciatice and eager for more.  There are many, many math tools I use in my classroom, and I’d love to share them…I even have a title:

The Math Tech Tool SmackDown!

60 minutes – 10 to 15 math tools, lots of oohs and aahs over their wonderfulness, some quick examples, a few cute anecdotes, and everyone leaves happy.

Teachers LOVE lists!

The list is also a cop-out.

List sessions are often one-sided affairs.  The presenter moves rapid-fire through tools with examples, and the time crunch to get to everything means little time for discussion.  The application and personalization are left for the user to figure out later.  They aren’t BAD sessions at all (heck, my last post on this blog is a list…and you’ll find many other lists buried here on the blog), just know going in that discussion of pedagogy will not be the order of the day.  Follow up that list session with a smaller group opportunity and syntthesize your new learning immediately.

I’m suddenly feeling less excited (and a little guilty) about my Math Tool Smack-Down.  Some twitter sharing from a colleague helps lend some clarity to my thoughts:

https://twitter.com/JGradyHHHS/status/615878743597424641

Yes!  It’s about best teaching practice – not the tool (duh!).  It’s easy to forget that in the tsunami of stuff (and swag) at a big tech conference.

Jed Butler is such a great math resource, and an awesome friend.  He came as a participant to my Desmos session, and ended up being a vital resource when the tech went south.  He also acted as my button-pusher, and general problem-solver.  On the last day of the conference, a lunch conversation of math tools developed into a potential ISTE talk for next year, featuring problem-posing as a framework for making use of apps and tools.  Such exciting conversation, and there will be a lot more to come this month when Jed and I (along with Mike Fenton and Glenn Waddell) share Desmos morning sessions at Twitter Math Camp.

Extending conversations beyond conferences – one of the most powerful aspects of my participation in the Math-Twitter-Blog-OSpehere.  Keep a lookout here on the blog as we get deeper into July as the group shares out classroom ideas.

Thanks to Priness Choi for sharing out her experience in my session.  Yes, I move around a lot!

Categories
Statistics Technology

Desmos + Statistics = Happiness

Sunday – a quiet evening before President’s Day – checking out twitter – not looking for trouble – and then,

Wait..what’s this?  Standard Deviation?  It was my birthday this past Saturday, and the Desmos folks knew exactly what to get me as a present.  Abandon all plans, it’s time to play.  A lesson I picked up from Daren Starnes (of The Practice of Statistics fame) is a favorite of mine when looking at scatterplots.  In the past, Fathom had been the tool of choice, but now it’s time to fly with Desmos.  There are a few nuggets from AP Statistics here, and efforts to build conceptual understanding.

CORRELATION, LSRL’S AND STANDARD DEVIATION

Click the icon to the right to open a Desmos document, which contains a table of data from The Practice of Statistics.  In you are playing along at home, this data set comes from page 194 of TPS5e and shows the body mess and resting metabolic rate of 12 adult female subjects. One of the points is “moveable” – find the ghosted point, give it a drag, and observe the change in the LSRL (least-squares regression line) – explore changes and think about what it means to be an “influential” point.

Next, click the “Means” folder to activate it.  Here, we are given a vertical line and horizontal line, representing the means of the explanatory (x) and response (y) variables. Note the intersection of these lines.  Having AP students buy into the importance of the (x-bar, y-bar) point in regression beyond a memorized fact is tricky in this unit.  Drag the point, play, and hopefully we can develop the idea that this landmark point always lies on the LSRL.

Another “fact” from this unit which can easily wind up in the “just memorize it” bin is this formula which brings together slope, correlation, and standard deviation:

The formula is given on the exam, with b1 acting as the slope, so even memorizing it isn’t required, but we can develop a “feel” for the formula by looking at its components.

Click the “Means plus Std Devs” Folder and two new lines appear. we have moved one standard deviation in each direction for the x and y variables. Note that the intersection of these new lines is no longer on the LSRL. But it’s pretty close…seems like there is something going on here.

Ask students to play with the moveable point, and observe how close the rise comes to the intersection point. Can it ever reach the intersection? Can we ever over-shoot it? In the “Rise Over Run” folder, we can then verify that the slope of the LSRL can be found by taking a “rise” of one standard deviation of y, dividing by a “run” of one standard deviation of x, and multiplying by the correlation coefficient, r.


There’s other great stuff happening in the Desmos universe as well.

1.  This summer brings the 4th edition of Twitter Math Camp, to be held at Harvey Mudd College in California. I’m thrilled to have latched onto a team leading a morning session on Desmos. Consider coming out for the free PD event, and join myself, Michael Fenton, Jed Butler, and Glenn Waddell for what promise to be awesome mornings. To be honest, I feel the Ringo of this crew….

2. Can’t make it to the west coast this summer? Join me at the ISTE conference in Philadelphia, where I will present a learning session: “Rethink Math Class with the Desmos Graphing Calculator“. Bring your own device and join in the fun!

3. Are you new to the world of Desmos? Michael Fenton has organized an outstanding series of challenges, with 3 difficulty levels, to help you learn by doing. Try them out – they promise to get you think about how you and your students approach relationships.

4. Merry GIFSmos everybody!  The team at Desmos has developed GIFSmos to let you build your own animated gifs from Desmos files. EDIT – as Eli noted in the comments, credit for GIFSmos goes to Chris Lusto.  Thanks for being so awesome, Chris!