Categories
Geometry Middle School

Building a Better Snowman

In a recent tour of my midde school, I observed a 6th grade teacher working with a class to use compasses.  Their goal: to make a snowman with segments of different, but given radii, 3cm, 2cm and 1cm.  Eventually, this will lead to students having their first experience with circumference, and that sneaky number pi.  But why tie students to fixed radii values?  And just what are the “perfect” measurements for a snowman?  Here are some lesson ideas for letting students explore their own snowmen, using technology, then taking it a step further by considering how much snow our snowmen will need.

Snowmen may come in all different sizes, with different accessories.  But it is pretty well established that the traditional snowman is made of 3 body segments.   Snowmen with anything other than 3 segments are blasphemous.

snowmen

WHAT ARE THE PERFECT SNOWMAN DIMENSIONS?

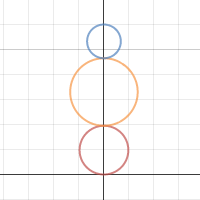
Clicking the image to the right will take you to an interactive graph I made using the Desmos calculator.  You can manipulate the diameter of each snowman segment by pulling the sliders provided, but the height of the snowman is fixed at 6 feet.  Like your snowman with equal segments?  Knock yourself out.  Are you more of a bottom-heavy snowman connoisseur?  There’s room on the bus for you , too.

Once you are convinved that you have built the world’s best snowman, please share your slider settings here.  I’d like to feature them in a later blog post.

INVESTIGATING YOUR SNOWMAN

For a classroom discussion, have students print out their snowman images (Desmos has a snazzy print feature), and compare their snowmen in groups.  Whose snowman would need the most snow to build?  Whose would need the least?  Or, if all of the snowmen are 6 feet tall, then will they use the same amount of snow?

This is a great time to talk about volume, and introduce the formula for the volume of a sphere.  And, since each student has their own product, have them find the volume of each snowman segment, then add them to get their required snow total.

HOW MUCH SNOW DO WE NEED?

If it snows 5″ overnight, will we have enough snow on the ground to build our snowman?  For this next stage, we can have students compare the volume of snow needed for their snowman with the volume of snow on the ground.  For example, if your yard is 10 feet long and 10 feet wide, will 5 inches of ground snow be enough to build our snowman?

BUT, we pack snow while we build snowmen.  How much less is the snow volume in a snowman vs its volume when it is on the ground?  2 times less volume?  5 times less?  10 times less?  I really have no idea.  Next time I have a few inches of snow on the ground, it will be experiment time.  With a class, perhaps debate the correct number and use it for calculations.

calculator

To help with calculations, and checking student work, I have created this handy Snowman Calculator on Excel.  You can input your a and b values from the Desmos document, along with the dimensions of a yard or rectangular area.  The volume of your snowman, along with needed snowfalls, are then given.

Think warm!  And then we will start working on sandcastles.

Categories
Algebra

Home on the Range (and the domain!)

A recent benchmark assessment in Algebra 1 I administered to our high school’s 1200 students in grades 9-11 provided some interesting data, as we prepared for the new “Keystone” Exams, which were given for the first time this past December.

The question below is taken from the Algebra 1 Eligible Content and Sample Items document, from PA Department of Education, Standards Aligned System website:

Range

This question was given to over 1,100 students in a 20-question assessment, and only 14% gave the correct answer of B.  Meanwhile, 66% gave the incorrect answer of A.  So, what am I worried about here?  And how can we use this result to improve our approach to domain and range our Algebra 1 courses?

When talking about range, there are two separate issues to consider:

  • Do students understand how to express the possibilities of a function’s “output”?
  • Have they been exposed sufficiently to the vocabulary which allows them to attach the word “domain” to the inputs and “range” to these outputs?

Where should domain and range be “taught”.  In Pennsylvania, understanding domain and range are part of the Algebra  1 standards for functions:

Identify the domain or range of a relation (may be presented as ordered pairs, a graph, or a table).

So, what’s the problem?  One of the issues I see is that we deal with linear functions so heavily in algebra 1, it is easy for students to begin to believe that every function has “all real numbers” as the domain.  Problems involving non-linear functions often provide natural “ins” for discussing domain and range, but we just don’t get to them until after domain and range have been defined, tested on, and forgotten.  A second issue is that of coverage.  Having students copy definitions into a notebook is simply not sufficient in order to “cover” domain and range.  Students need to see experience the need to communicate domain and range, have a part in developing notation, and see the vocabulary reinforced appropriately in all math courses.  Here’s an station activity you can use with your classes to develop input/output sense.

INPUT/OUTPUT STATIONS

The file with the problems for this activity are here: input/output activity

The file contains 6 stations.  2 of the stations are problem scenarios, 3 are graphs, and 1 gives a function rule.  Here’s one of the scenarios:

A tomato plant is purchased from a local nursery.  When purchased, the plant had a height of 5 inches.  After it is planted, the plant grows an average of 5 inches each week.  After 10 weeks, the plant reaches its maximum height, and we all begin to enjoy the yummy tomatoes!  Let x represent the number of weeks after the plant is placed in the ground, and let y represent the plant’s height.

Place the problems around the room, along with signs for “possible inputs” and “possible outputs”

Board1

listsNext, provide each student (or pairs) with a few potential input and outputs, writing them on a 3×5 card.  3 or 4 of each will suffice, and try to give a variety of positives and negatives, along with a fraction and/or decimal.  Some samples are here.

Have students visit each station, and list items from their card which are appropriate to the scenario.  Soon, both lists begin to populate with inputs and outputs, for all of the stations around the room.

Board2

When all students are satisfied that they have placed their values correctly, let’s add a twist.  Assign each partnership a station, having them provide a value NOT appropriate to the problem along with a justification for their choice.

Board3

After all students have visited stations and shared their input/output values, we’d like students to summarize the input/output lists.  One method for this is to assign partnerships a different station, and have them write a summary underneath the shared values.  For example, in the tomato problem, we could see:

  • Input values: x must be between 0 and 10, inclusive.  No decimals.
  • Output values:  y must be between 5 and 55, inclusive.

Now is the time to introduce our friends: domain and range.  And, given the variety of problems we have seen on the board, we will have different means for communicating domain and range.  Sometimes, all real numbers is appropriate, while other times the list is best given as an inequality.  In other problems, a simple list may do.  Do we need to restrict to integers?

There’s no hurry to develop formal symbols for all of the stations right away.  Perhaps complete one a day, and keep the ball rolling by providing problems which cause students to need to talk about restrictions.  And finally, don’t limit discussion of domain and range to just the introduction to functions unit.

Categories
Algebra Technology

You Asked For Piecewise Functions, I Give You Piecewise Functions!

NEW: After popular demand from this post, I have created a tutorial on domain restrictions and piecewise functions.  Enjoy!


UPDATE: Many of my Desmos files are avilable on this page: Desmos File Cabinet Enjoy!

Let is never be said that mathcoachblog doesn’t listen to the needs of its followers!  One of the neat things about having a blog is checking out the routes people take to get to the blog. What search caused them to arrive here?  What countries are my visitors from?  What search phrases cause them to reach the blog?

Every day, without fail, there is a theme which appears in the search terms of blog visitors.  Here is a sampling of terms from just the last week:

  • Online piecewise graphing calculator
  • Graph a piecewise function online calculator
  • Piecewise function calculator online
  • Graphing piecewise functions calculator online
  • Piecewise functions online grapher
  • Online graphing calculator piecewise functions
  • How to do a piecewise function on Desmos

OK, folks I get it.  We want to graph piecewise functions.  So, let’s light this candle.

GRAPHING PIECEWISE FUNCTIONS ON DESMOS

The Desmos knowledge base provides instructions for graphing a piecewise function, and a neat video tutorial.  But I’ll provide a few examples here, and some teaching tips.  Let’s say we want to graph this piecewise function:

In the Desmos calculator, colons are used to separate domain restrictions from their functions.  And commas are used to have multiple function rules in one command.  So, the piecewise function above would be entered as:

Piecewise Entry

The function then appears quite nicely:

Function1

Sliders can be used to have students explore the continuity of a piecewise function.  Consider this problem:

For what value(s) of x is the piecewise function below continuous?

In Desmos, start by defining a slider for the parameter “a”.  For mine, I chose to limit the domain to between -10 and 10, and have step counts of .5.  Then, a can be used in the piecewise function.  Click the icon below to play with the document online.  The sharing features are another aspect of Desmos which have improved greatly in the past year.

SO, WHY ARE YOU AVOIDING “EQUALS” IN YOUR FUNCTIONS?

OK, smart guy, yes…yes, I have kinda avoided the equals parts of the domain restrictions.  Something neat (odd, goofy) happens when an equals is used in the domain restrictions.  Let’s graph this function:

Click this link to find out what happened when I tried to enter this function on Desmos.  The Desmos folks tend to monitor these things, so let’s see if they have a suggestion here.

Down the road, I want to take a deeper look at the new table feature, and will report out.  But my early impression is that it is a addition which works seamlessly with the existing, awesome, calculator.

Also, while I’m in a sharing mood, here is a quick file I created to use in an absolute value inequality unit.  Click below to check it out.  Would enjoy your input!

And finally, I started this post by sharing some of the search terms which cause people to find my blog.  Most of the time, I can explain those terms, and why people would end up here.  But this….well….this, I got nothing…..

search terms