UPDATE – a newer post concerning this project, with rubric can be found with this post.
I can tell it’s the end of the school year, and math teachers are looking for fun math projects to do with their classes, as the search terms which get people to my blog contain lots of references to “conics projects, “math art projects” and the like. The searches have led to many hits to my conic sections art project blog post from last June.
At my home high school, this is the second year we have done our long-standing conic sections art project using the Desmos calculaor, and this year’s submissions have raised the bar considerably. The most improvement has come from working with students to restirct domains, which has made more complex drawings easier to manage. Here are a few to share, but look for an announcement from Desmos, with whom I will present a webinar on June 6 and give you some ideas for getting started with your class.
First off, a tiger, which took over 100 individual equations to create. Stunning!
Next up, an ambitious student who took 87 different picture “slides” to create this animated gif. I wish I was half this creative when I was 15!
Check out the recording from the Global Math Department for more information, and be on the lookout for webinar information on the 6th! Meanwhile, let me check some of our other Algebra 2 classes for some promising projects!
This coming Tuesday, April 9, the fantastic online graphing calculator Desmos will be featured in a webinar held through the Global Math Department. This is part of a weekly math conference series hosted by bigmarker.com. Some weeks, there is a set theme, while other weeks teachers present their favorite lesson. It’s exciting to hear some of the math teachers I have come to respect and admire through twitter and blogs share their favorite lessons, and you will always find something worth adapting for your classroom. You can check out an archive of past webinars on the conference section of the Global Math Department on bigmarker.com. I am looking forward to sharing my conic section lesson this week, and the agenda is packed with great ideas for Desmos, including:
@samjshah – Using sliders in polar equations to study conic sections
@Mr_Stadel – an exploration of gemetric shapes
@MrOrr_geek – Creating pictures using function transformations
Pop in and say hello, or come back later and enjoy the webinar archive.
DESMOS MAKES TABLES NOW!
Earlier this year, Desmos unleashed its table feature, and it is a seamless addition to an already simple tool. You have choices for how to implement a table in a Desmos document. Start a new table, and enter a rule in the “y” position. Or take an existing function, and “edit” it to become a table. Or, name your function as f(x) and Desmos will recognize it in a new table. Here, a quadratic function was converted to a table, and a new column added to compute values of the derivative.
Think about the conversations you can with your class about this. How do the values of the rule “2x+4” relate to the graph of the quadraic function? When does 2x+4 take on positive / negative value? When is it zero?
Play with the Desmos graph by clicking on the link, and enjoy the table feature.
DAILY DESMOS
Sometimes it’s the simplest idea that produces the biggest wow moments, and the Daily Desmos site earns my kudos for not only its simple, powerful concept, but also its potential for differentiation. Each day, 2 new graphs generated on Desmos are given. It is up to you, or your students to determine how the graph was made. How was this graph made?
Many of us teach high schoolers how to graph trig functions, and our students certainly know linear functions. So, how to combine them?
The site also challenges users to contribute their own graphs and provides guidelines for basic and advanced graphs. What a fantastic tool for differentiation: allow you quick finishers to pursue a Desmos graph, and show off their ideas to the world. Print out the graphs, post them around your room, and let math go beyond the mundane and routine. When you have your first conversation about polar coordinates and functions with your class, when you weren;t planning to have it, you’ll know you are doing something right for your kids! Thanks to Michael Fenton for starting the Daily Desmos. Keep up the great work!
NEW: After popular demand from this post, I have created a tutorial on domain restrictions and piecewise functions. Enjoy!
UPDATE: Many of my Desmos files are avilable on this page: Desmos File Cabinet Enjoy!
Let is never be said that mathcoachblog doesn’t listen to the needs of its followers! One of the neat things about having a blog is checking out the routes people take to get to the blog. What search caused them to arrive here? What countries are my visitors from? What search phrases cause them to reach the blog?
Every day, without fail, there is a theme which appears in the search terms of blog visitors. Here is a sampling of terms from just the last week:
Online piecewise graphing calculator
Graph a piecewise function online calculator
Piecewise function calculator online
Graphing piecewise functions calculator online
Piecewise functions online grapher
Online graphing calculator piecewise functions
How to do a piecewise function on Desmos
OK, folks I get it. We want to graph piecewise functions. So, let’s light this candle.
GRAPHING PIECEWISE FUNCTIONS ON DESMOS
The Desmos knowledge base provides instructions for graphing a piecewise function, and a neat video tutorial. But I’ll provide a few examples here, and some teaching tips. Let’s say we want to graph this piecewise function:
In the Desmos calculator, colons are used to separate domain restrictions from their functions. And commas are used to have multiple function rules in one command. So, the piecewise function above would be entered as:
The function then appears quite nicely:
Sliders can be used to have students explore the continuity of a piecewise function. Consider this problem:
For what value(s) of x is the piecewise function below continuous?
In Desmos, start by defining a slider for the parameter “a”. For mine, I chose to limit the domain to between -10 and 10, and have step counts of .5. Then, a can be used in the piecewise function. Click the icon below to play with the document online. The sharing features are another aspect of Desmos which have improved greatly in the past year.
SO, WHY ARE YOU AVOIDING “EQUALS” IN YOUR FUNCTIONS?
OK, smart guy, yes…yes, I have kinda avoided the equals parts of the domain restrictions. Something neat (odd, goofy) happens when an equals is used in the domain restrictions. Let’s graph this function:
Click this link to find out what happened when I tried to enter this function on Desmos. The Desmos folks tend to monitor these things, so let’s see if they have a suggestion here.
Down the road, I want to take a deeper look at the new table feature, and will report out. But my early impression is that it is a addition which works seamlessly with the existing, awesome, calculator.
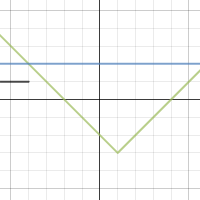
Also, while I’m in a sharing mood, here is a quick file I created to use in an absolute value inequality unit. Click below to check it out. Would enjoy your input!
And finally, I started this post by sharing some of the search terms which cause people to find my blog. Most of the time, I can explain those terms, and why people would end up here. But this….well….this, I got nothing…..